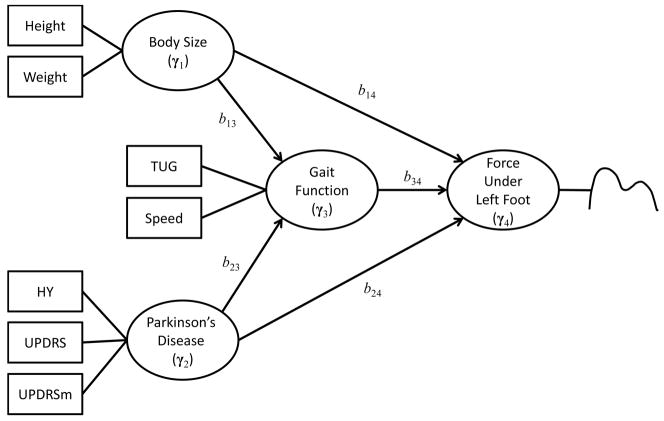
Figure 1.
The hypothesized directional relationships among the four sets of responses. In the path diagram, a circle represents a set; a square indicates an observed variable in the set; a curve right next to the set, force under left foot, indicates that this set consists of functional data. A more detailed description of the observed variables is given in Section 5.

