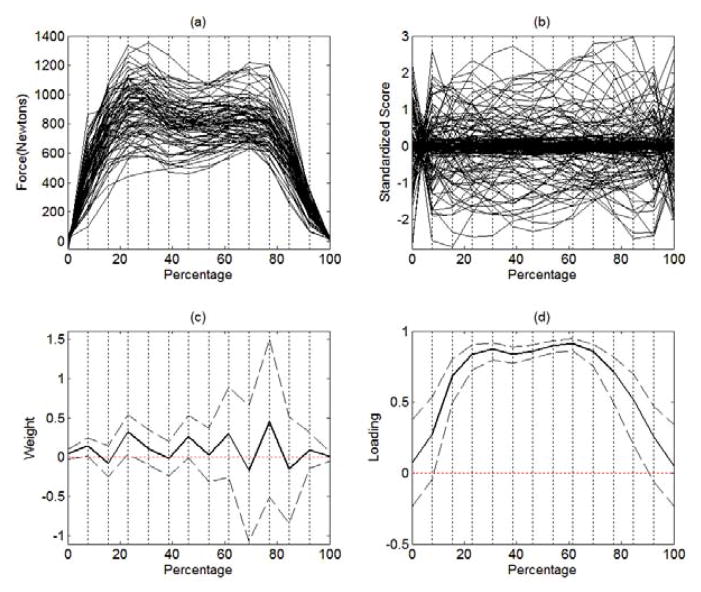
Figure 10.
(a) The evaluated mean curves: the dotted vertical lines indicate the locations of the 14 equally spaced percentage occasions at which the mean curves are evaluated. (b) The standardized data: the mean of each percentage occasion is zero and the standard deviation of each percentage occasion is unity. (c) The estimated weights for the 14 percentage occasions (in solid line) with 95% pointwise bootstrap confidence interval (in dashed line). (d) The estimate loadings for the 14 percentage occasions (in solid line) with 95% pointwise bootstrap confidence interval (in dashed line).

