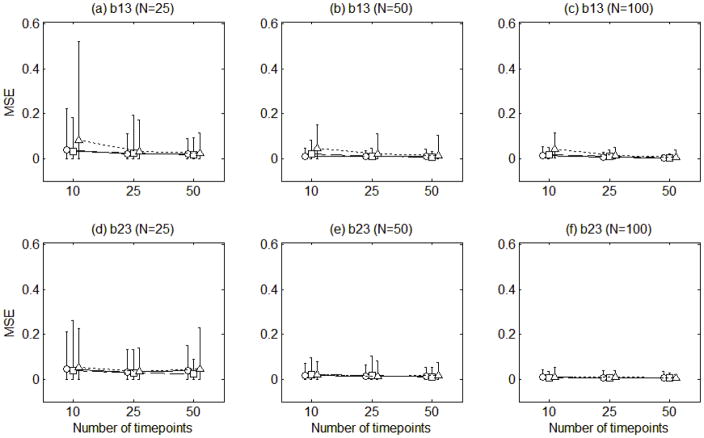
Figure 7.
The mean squared errors of the estimates of the two path coefficients (b13, b23). The circles connected with solid lines are for the error variance of 0.5, the squares connected with dashed lines for error variance of 1, and the triangles connected with dotted lines for error variance of 2. The error bars indicate the ranges of the mean squared errors.

