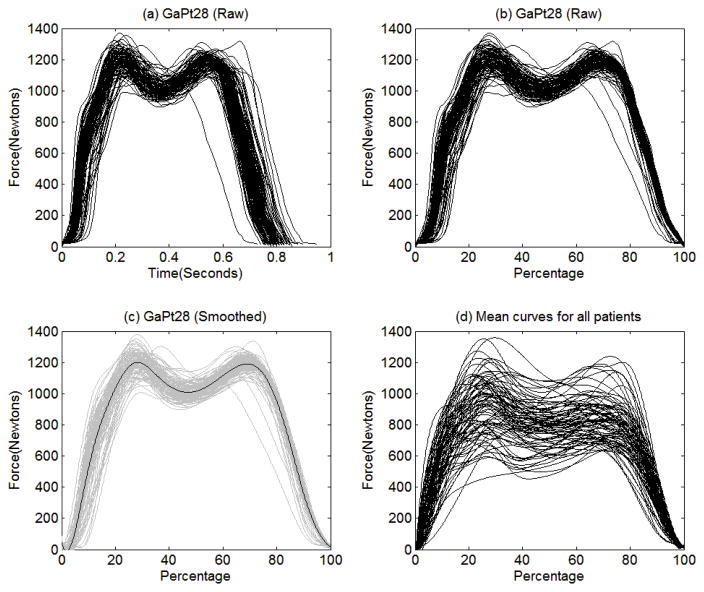
Figure 8.
The raw data of the 104 gait cycles completed by the patient (GaPt28) are plotted against (a) clock time (in seconds) and (b) percentage completed. The gray curves in (c) are the smoothed curves for the 104 gait cycles and the black line indicates the mean curve of the 104 smoothed curves. The mean curve obtained from each of the 83 patients is plotted in (d).

