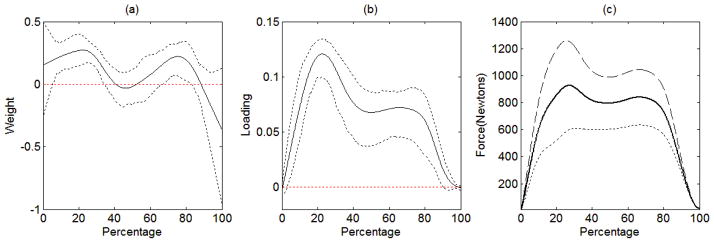
Figure 9.
The estimated weight function (solid line) with the pointwise 95% bootstrap confidence interval (dashed lines) is displayed in (a). The estimated loading function (solid line) with 95% pointwise bootstrap confidence interval (dashed lines) is displayed in (b). The predicted data functions associated with different values of component scores are displayed in (c). The thick line is the mean curve of the 83 patients, the thin dashed line indicates the predicted data function when the component score is 2 standard deviations above the mean, and the thin dotted line indicates the predicted data function when the component score is 2 standard deviations below the mean.

