
Figure 3.
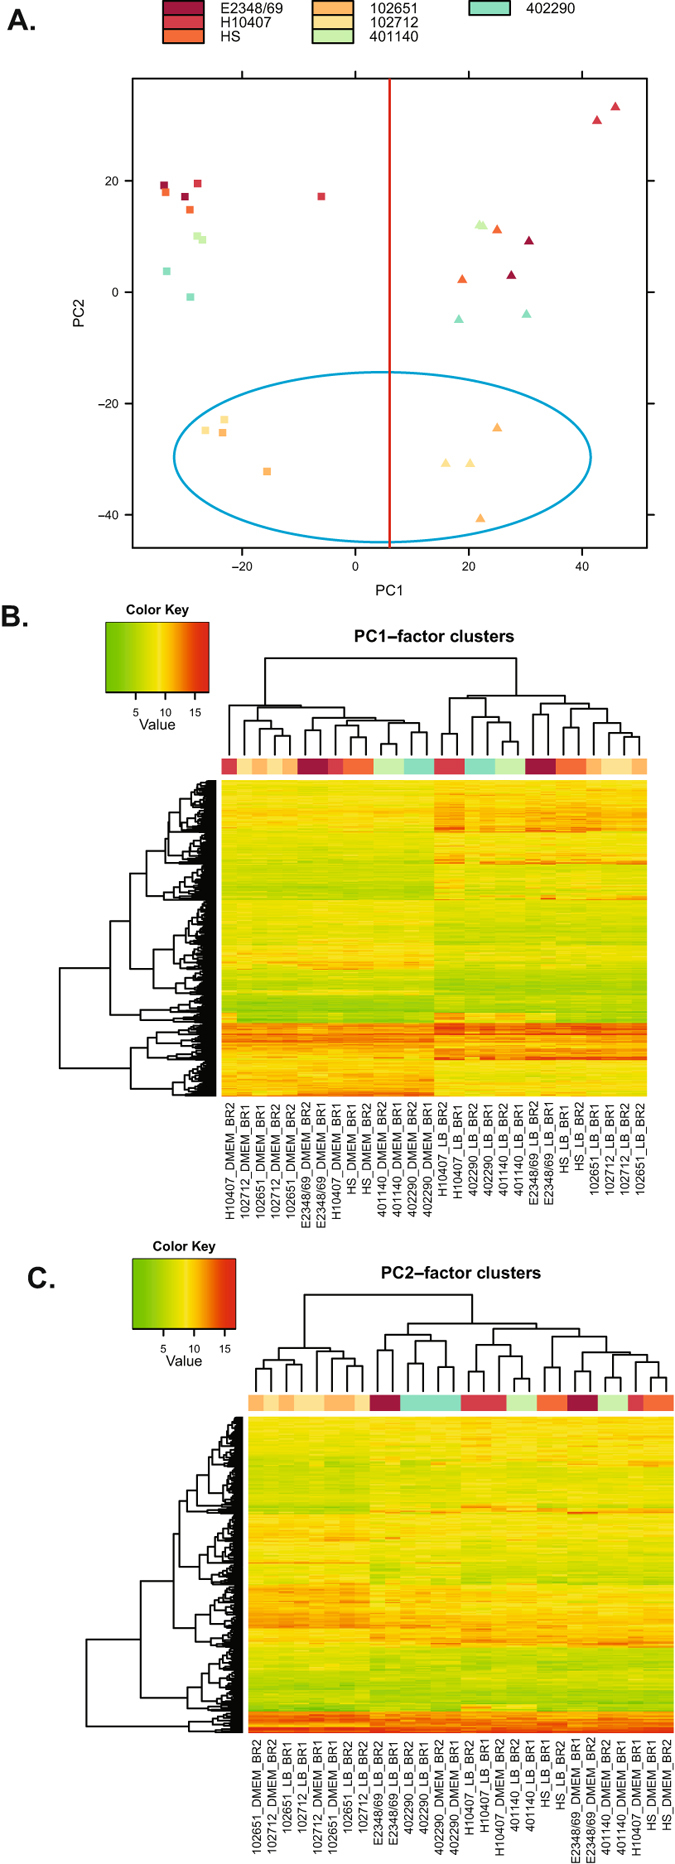
Analysis of the LB and DMEM RNA-Seq samples from all of the E. coli isolates. (A) Principal component (PC) analysis of the normalized expression values of the LB and DMEM samples for ETEC isolate H10407, non-pathogenic isolate HS, EPEC isolates E2348/69 and 402290, and the EPEC/ETEC hybrid isolates 102651, 102712, and 401140. Each of the RNA-Seq samples is indicated by a different color in the legend at the top of the panel. The squares represent the DMEM samples and the triangles represent the LB samples. The red line separates all of the LB and DMEM samples, and the blue circle identifies the samples of the LT+ EPEC/ETEC isolates 102651 and 102712. (B) Hierarchical clustering of 520 gene clusters of PC1 and (C) 263 gene clusters of PC2. The heatmaps in these two panels display the normalized gene expression values of the LS-BSR gene clusters that were present in all of the genomes and had the greatest deviation in their expression values.