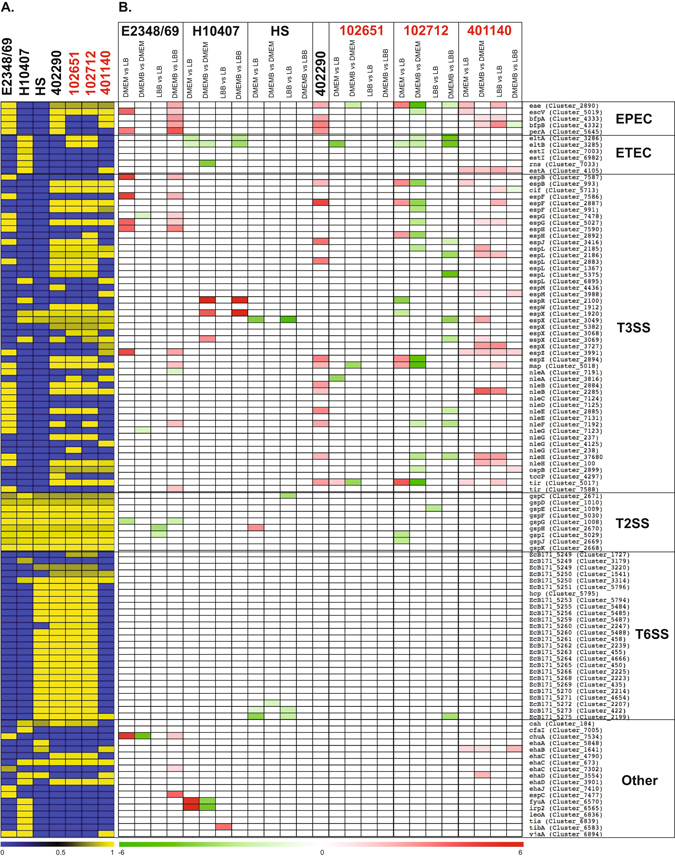
Figure 6.

Differential expression of E. coli virulence genes. (A) In silico detection of E. coli virulence genes in each of the E. coli genomes analyzed in this study using RNA-Seq. The colors of the heatmap represent the BSR values of each gene with yellow indicating a gene is present and blue indicating a gene is absent. (B) Heatmap of the differential expression of the virulence genes for each of the sample comparisons of the E. coli isolates. Only significant log2 fold-change (LFC) values ≥1 or ≤−1 are represented in the heatmap. Red indicates increased differential expression while green indicates decreased differential expression. White indicates that a gene was either not present in the E. coli isolate, and/or did not exhibit significant differential expression. The only sample comparison of EPEC isolate 402290 that is shown is for DMEM compared to LB since this isolate was analyzed previously and was not grown with added bile salts (Hazen et al. unpublished).
