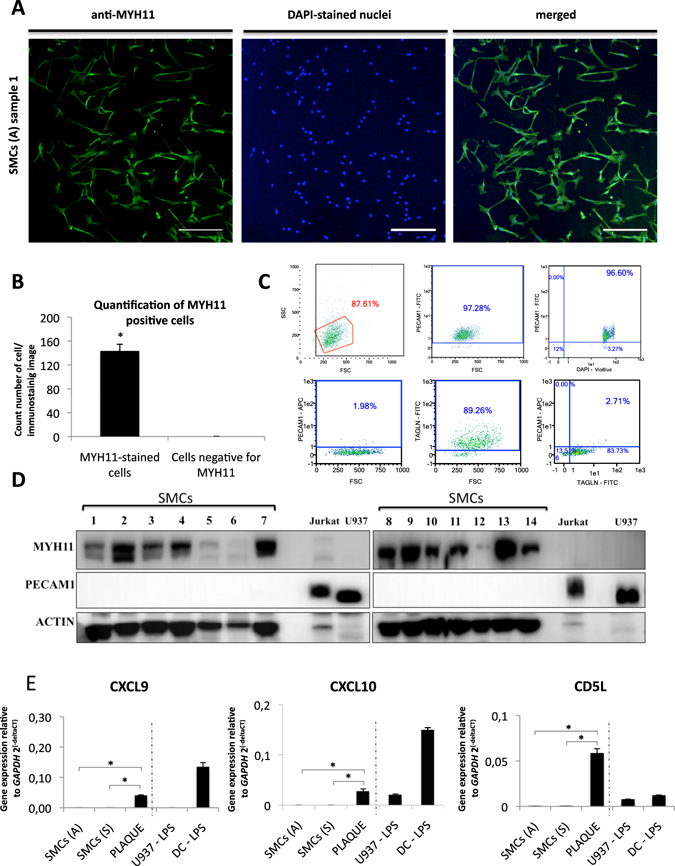
Figure 1.

Quality control analysis. (A) Representative confocal images of MYH11-positive cells (left panel) and DAPI-stained cells (central panel) and merged (right panel). Magnification: the horizontal bars represent a scale of 250 μm; (B) Quantification of MYH11-positive cells versus total number of cells (DAPI-stained nuclei). Data are mean ± SD. *p < 0.05. (C) Flow cytometry graphs indicating expression of endothelial marker PECAM1 and SMCs marker TAGLN in SMC cultures (lower panels) and PECAM1 detection in U937 as positive control (upper panels). (D) Western blot detection in all our SMCs cultures of MYH11 and PECAM1 with ACTIN as loading control. Positive detection of PECAM1 and negative detection of MYH11 in Jurkat and U937 cells. (E) Gene expression quantification of macrophages markers (CXCL9, CXCL10 and CD5L) performed by qPCR using RNA extracted from: (i) SMCs from asymptomatic patients (average of 7 samples); (ii) SMCs from symptomatic patients (average of 7 samples); (iii) atheroma plaque (average of 3 samples); (iv) monocyte cell line U937 treated with LPS; (v) CD14+ monocyte-derived dendritic cells treated with LPS.
