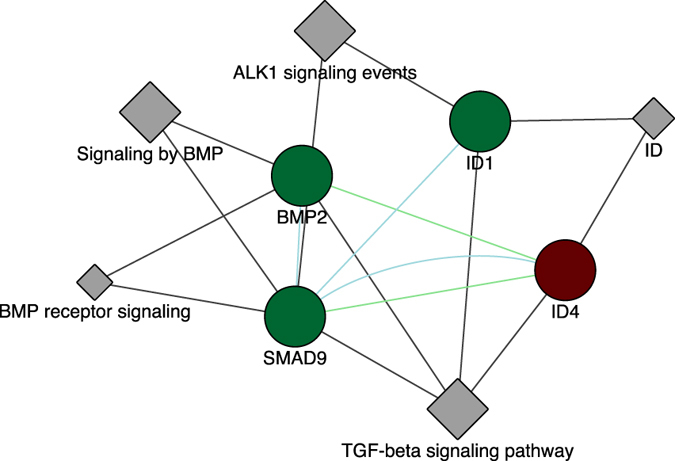
Figure 3.

MCODE network clustering analysis. Illustration of the identified cluster by the network clustering algorithm MCODE showing the interaction between ID4, ID1, BMP2, SMAD9, TGF-beta signaling, BMP signalling and ALK1 signaling. The circles are genes and the rhomboids are protein domains. Green lines represent genetic interactions. Green circles indicate downregulated genes in S vs A and the purple circle indicates upregulated gene in S vs A. Blue lines represents pathways. Grey lines indicate gene-pathway associations.
