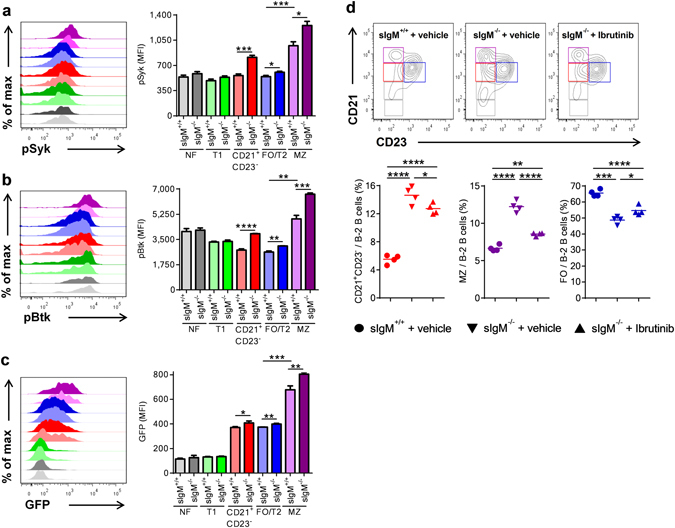
Figure 2.

sIgM deficiency results in increased B cell receptor signaling in vivo. Representative flow cytometry plots and bar graphs show (a–c) the mean fluorescence intensity (MFI) for pSyk, pBtk levels and Nurr77-GFP expression in FO/T2 (blue), MZ (purple), CD21+ CD23− (red), T1 (green) and NF (grey) B cells (as defined in Fig. S2) of sIgM +/+ or Nur77-GFP/sIgM +/+ (light colored bar) and sIgM −/− or Nur77-GFP/sIgM −/− (dark colored bar) mice. Data shown are from one representative experiment (a,b) or pooled (c) from two/three independent experiments. (d) Representative flow cytometry plots and dot plots show the frequencies of CD21+ CD23− (red), FO (blue) and MZ (purple) B cells within B-2 cells of sIgM +/+ (●) and sIgM −/− (▼) mice treated with vehicle, and sIgM −/− (▲) mice treated with the Btk inhibitor Ibrutinib. All results show mean ± SEM, n = 4–6 mice per group. *P < 0.05, **P < 0.01, ***P < 0.001, ****P < 0.0001 (unpaired or paired t test or One-Way Anova test followed by Tukey’s test).
