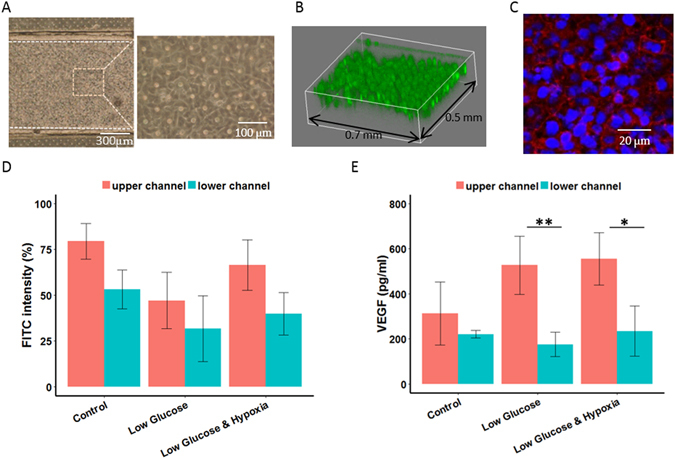
Figure 2.

Characterisations of ARPE-19 cells. (A–C) Qualitative assessment of the monolayer inside a microfluidic device. (A) Optical microscopic image, (B) 3D confocal microscopic image (cell tracker green), and (C) fluorescent image (blue: nucleus; red: ZO-1). (D,E) Plots of permeability to FITC-Dextran and concentrations of VEGF secretion under different conditions imposed by altering glucose concentration and/or adding CoCl2 to the medium. Data sets were analyzed using 2-way ANOVA tests (showing a significant interaction effect for (E), p = 0.04); the asterisks * indicate significant findings from Tukey’s post-hoc tests. (D) mean FITC intensity (%) from lower channels is significantly different than those from upper channels (*p = 0.0005); pairwise comparisons between conditions are insignificant. (E) Pairwise comparisons between experimental conditions are insignificant while pairwise comparisons among the condition (red and blue bars for low glucose and low glucose & hypoxia) are significant (**p = 0.0022 and *p = 0.0162, respectively). N = 9 for (D) and (E).
