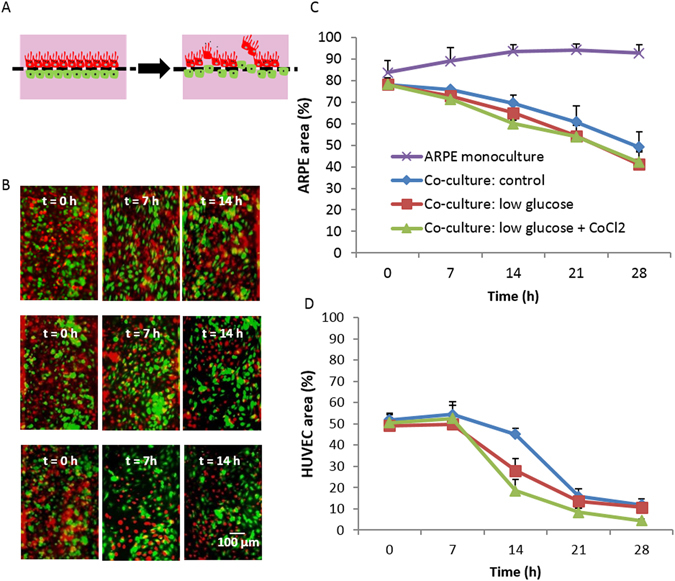
Figure 4.

Analysis of the co-culture model. (A) Anticipated behaviour of cells within the microfluidic device where ARPE-19 detached due to the invasion of HUVEC; (B) Overlaid images of ARPE-19 and HUVEC at different time points; top row: control, middle row: low glucose, bottom row: low glucose with the addition of CoCl2; ARPE-19 is depicted in red and HUVEC in green in all cases. (C,D) Quantification of the ARPE-19 and HUVEC growth area under different medium conditions and monoculture of ARPE in DME High glucose medium. Data were analyzed using 2-way ANOVA tests (showing a significant interaction effect, p < 0.0001 for (C) and (D)). Significant difference between the ARPE monolayer (purple line) and the co-culture groups (blue, red and green lines) is observed from t = 7 and onwards (p ≤ 0.0001). Pairwise comparisons between co-culture control and low glucose & hypoxia at t = 14 h (p = 0.023), and between all co-culture groups at t = 21 and t = 28 h (p < 0.0001) are significant in (C). In (D), pairwise comparisons for low glucose and low glucose & hypoxia groups (red and green lines) at t = 14 compared to t = 0 are significant (p ≤ 0.001). N = 7.
