Figure 5.

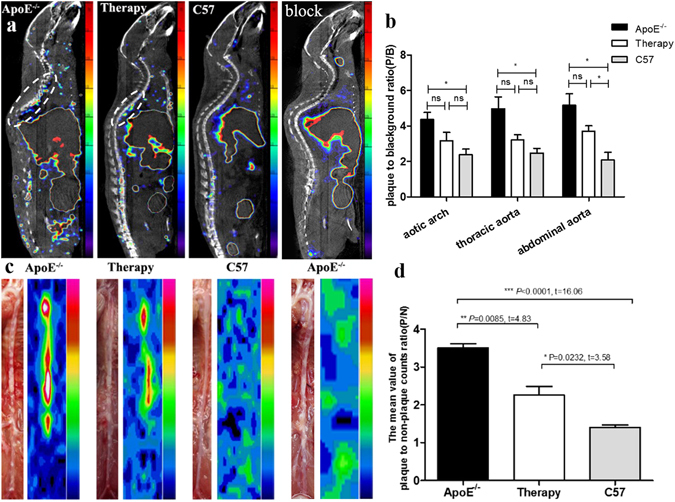
In-vivo micro-SPECT/CT, ex-vivo BSGI imaging and semi-quantitative analysis. (a) Micro-SPECT/CT images (saggital) of untreated, treated ApoE−/−, C57BL/6 J mice and ApoE−/− mice with blocking at 4 h post injection of 99mTc-MAG3-bevacizumab, tracer accumulated area in thoracic aorta highlighted with oval white dotted line. (b) The semi-quantitative analysis results of micro-SPECT/CT scannings expressed as plaque-to-background ratio (P/B) for different parts of aortic plaque radioactivity uptake among different groups. (c) Ex vivo planar imaging of aorta by breast specific gamma imaging (BSGI). (d) The semi-quantitative analysis of mean value of plaque to non-plaque counts ratio (P/N) for BSGI imaging among untreated, treated ApoE−/− and C57BL/6 J mice groups.
