Figure 7.

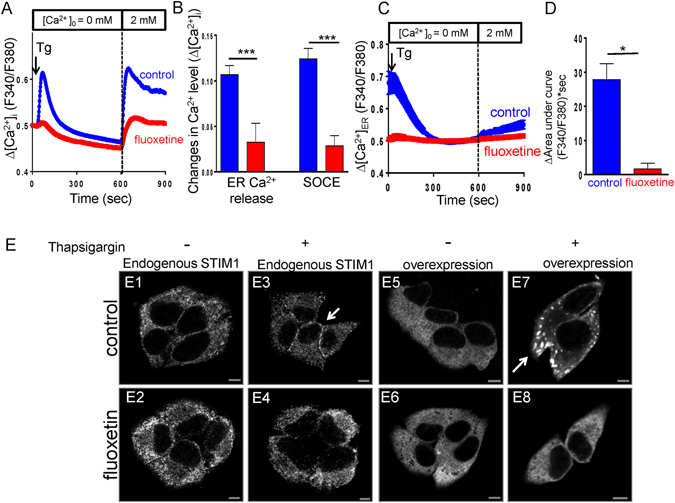
Fluoxetine inhibits the ER calcium release and SOCE activation. (A) Fluoxetine inhibits thapsigargin-induced SOCE activation. Mean traces of [Ca2+]i measurement from at least 70 different cells in each experiment. The SOCE amplitude indicates the rise of [Ca2+]i in replenishment of [Ca2+]0 from 0 to 2 mM. Arrow, adding 2 μM thapsigargin (Tg). (B) Quantitative analyses of Δ[Ca2+]i. Each value represents mean ± SEM of at least 70 individual cells. ***P < 0.001 (C) Representative measurements of ER Ca2+ level ([Ca2+]ER) in MIN6 cells. Mean traces of [Ca2+]ER measurement from at least 30 different cells in each experiment. (D) Quantitative analyses of Δ[Ca2+]ER. Each value represents mean ± SEM of at least 60 cells. *P < 0.05 (E) Fluoxetine blocks STIM1 membrane trafficking. Representative confocal images of endogenous STIM1 or transiently expressed eGFP-STIM1 at control and after 5 min of exposure to thapsigargin (2 μM) in MIN6 cells treated with or without fluoxetine. Scale bar, 5 μm.
