Figure 1.

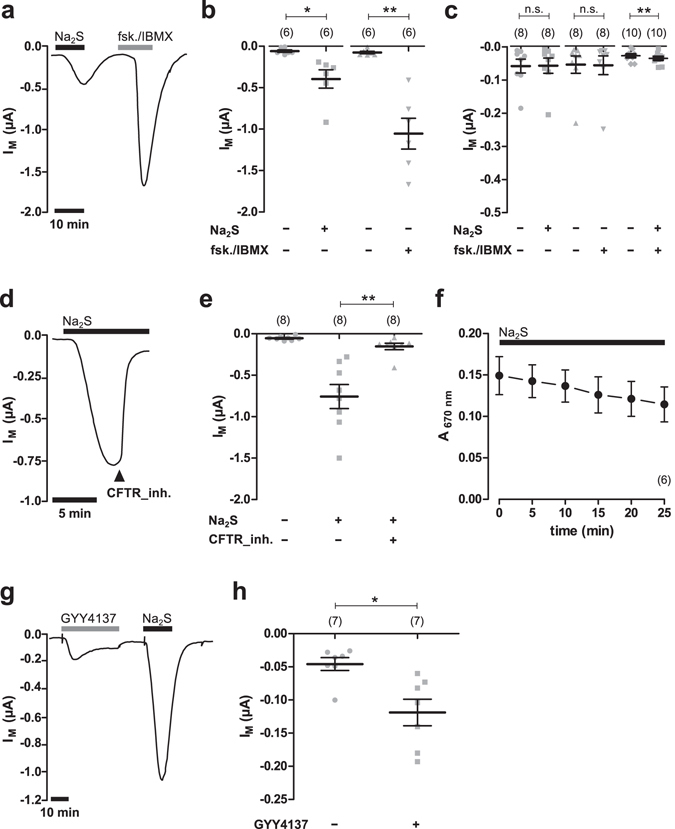
Hydrogen sulfide stimulates CFTR in Xenopus oocytes. (a) A representative current trace of a TEVC recording of a CFTR-expressing oocyte. The application of Na2S (50 µM, black bar) as well as forskolin (fsk.; 5 µM) and IBMX (100 µM; grey bars) led to an increase in transmembrane current signals (IM). (b) Statistical analysis of data obtained from experiments as shown in panel a. Depicted are values of IM (before drug application or peak values after drug application) from individual experiments (grey symbols) as well as means ± SEM (*P ≤ 0.05, Wilcoxon signed rank test; **P ≤ 0.01, Student’s paired t-test). (c) Summarised data from experiments as similar to those shown in panels a and b, using native, non-CFTR-expressing oocytes. Values of IM were taken at time point were CFTR-expressing oocytes of the same donor had the maximal response to the drugs. Depicted are means ± SEM (**P ≤ 0.01, Student’s paired t-test). (d) A representative current trace of a TEVC recording of a CFTR-expressing oocyte. After application of Na2S (50 µM, black bar), the CFTR inhibitor CFTR_inh172 (CFTR_inh.; 25 µM) was additionally applied. This readily inhibited values of IM. (e) Statistical analysis of data obtained from experiments as shown in panel d. Depicted are values of IM (before drug application or peak values after drug application) from individual experiments (grey symbols) as well as means ± SEM (**P ≤ 0.01, Wilcoxon signed rank test). (f) Evaporative loss of H2S was measured by monitoring the concentration of H2S in the employed buffers solutions by the formation of methylene blue. Depicted are values for methylene blue absorbance at 670 nm over time. Na2S (50 µM) exposure is indicated by the black bar. (g) A representative current trace of a TEVC recording of a CFTR-expressing oocyte. Both, GYY4137 (500 µM, grey bar) as well as Na2S (50 µM, black bar) stimulated IM. (h) Statistical analysis of data obtained from experiments as shown in panel g. Depicted are values of IM (peak values after drug application) from individual experiments (grey symbols) as well as means ± SEM (*P ≤ 0.05, Wilcoxon signed rank test). Numbers of experiments (n) are indicated in parentheses.
