Figure 2.

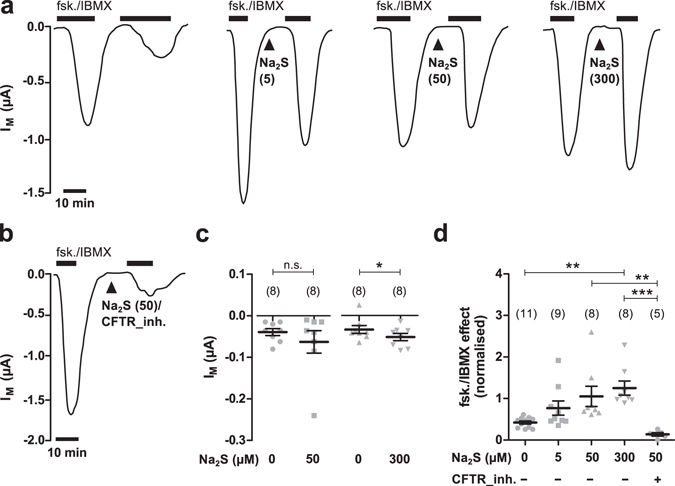
H2S potentiates the effect of forskolin and IBMX. (a) Representative current traces of TEVC recordings of CFTR-expressing oocytes. Transmembrane currents (IM) were recorded and oocytes were exposed twice to forskolin (fsk., 5 µM) and IBMX (100 µM, black bars) without or with application of Na2S (arrowheads; concentration in µM is indicated by numbers in parentheses) between the first and second stimulation with forskolin/IBMX. (b) Representative current trace of a TEVC recording of a CFTR-expressing oocyte. Similar to experiments shown in panel a, oocytes were stimulated twice with forskolin/IBMX and Na2S (50 µM) together with the CFTR inhibitor CFTR_inh172 (CFTR_inh., 25 µM) between the first and second application of forskolin/IBMX. (c) Statistical analysis of data obtained from experiments as shown in panel a. Depicted are values of IM (peak values after drug application) from individual experiments (grey symbols) as well as means ± SEM, before and after application of Na2S (*P ≤ 0.05, Student’s paired t-test). (d) Statistical analysis of data obtained from experiments as shown in panels a and b. Depicted are normalised values from individual experiments (grey symbols) as well as means ± SEM of forskolin (fsk.)/IBMX effects. This represents the ratio of the first and second current stimulated by forskolin/IBMX (**P ≤ 0.01, ***P ≤ 0.001, Kruskall-Wallis test followed by Dunn’s Multiple Comparison Test). Numbers of experiments (n) are indicated in parentheses.
