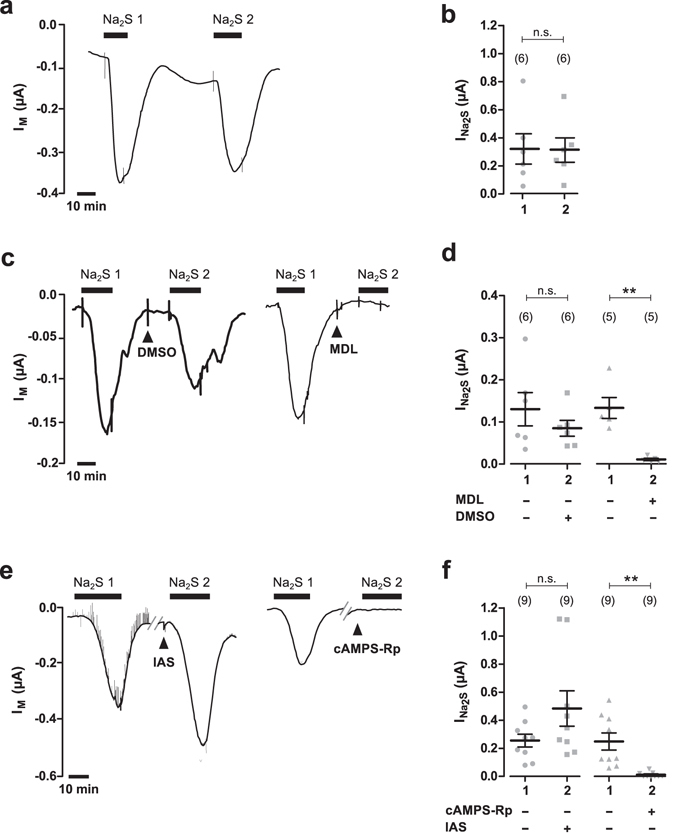
Figure 3.

H2S stimulates CFTR via cAMP- and PKA-mediated signalling. (a) Representative current trace of a TEVC recordings of a CFTR-expressing oocyte. Transmembrane currents (IM) were recorded and the oocyte was exposed twice to Na2S (50 µM, black bar). (b) Statistical analysis of data obtained from experiments as shown in panel a. Depicted are values of the first (1) and second (2) Na2S-induced current (INa2S) from individual experiments (grey symbols) as well as means ± SEM (n.s. = not significant, Student’s paired t-test). INa2S was calculated by subtracting the current before application of Na2S from the peak value after application of Na2S, resulting in positive values for INA2S. (c) Representative current traces of TEVC recordings of CFTR-expressing oocytes. Transmembrane currents (IM) were recorded and oocytes were exposed twice to Na2S (50 µM, black bar) DMSO (0.1%; left trace) or the AC inhibitor MDL 12330 A (MDL, 20 µM; right trace) were applied between the first and second stimulation with Na2S (black arrowheads). (d) Statistical analysis of data obtained from experiments as shown in panel a. Depicted are values of the first (1) and second (2) Na2S-induced current (INa2S) from individual experiments (grey symbols) as well as means ± SEM (**P ≤ 0.01, Student’s paired t-test). INa2S was calculated by subtracting the current before application of Na2S from the peak value after application of Na2S, resulting in positive values for INA2S. (e) Representative current traces of TEVC recordings of CFTR-expressing oocytes. Transmembrane currents (IM) were recorded and oocytes were exposed twice to Na2S (50 µM, black bar). The perfusion recording was stopped briefly between the first and second stimulation with Na2S (grey lines). Then, an intracellular-analogous solution (IAS) or IAS containing the PK-antagonist cAMPS-Rp (87 µM) were injected into the oocytes before the second stimulation with Na2S (black arrowheads). (f) Statistical analysis of data obtained from experiments as shown in panel a. Depicted are values of the first (1) and second (2) Na2S-induced current (INa2S) from individual experiments (grey symbols) as well as means ± SEM (**P ≤ 0.01, Wilcoxon signed rank test). Numbers of experiments (n) are indicated in parentheses.
