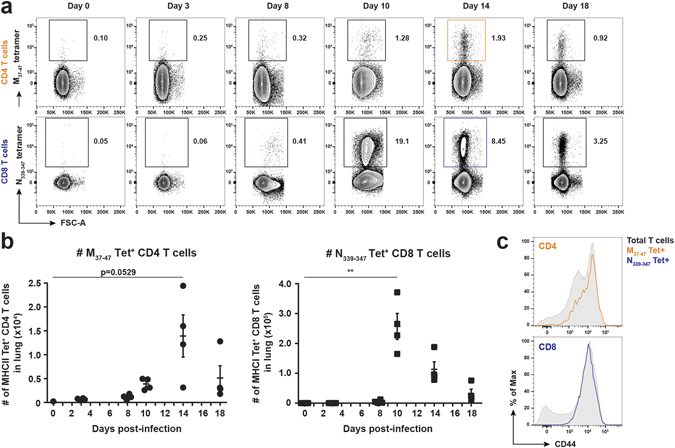
Figure 3.

In vivo characterization of the virus-specific CD4 and CD8 T cell response in PVM-infected mice. 7 week old C57BL/6 females were infected i.t. with a sub-lethal dose of PVM strain J3666 or were used as uninfected controls (day 0). At the indicated time points post-infection, virus-specific CD4 and CD8 T cells in the lung were identified by flow cytometry, using M37–47 and N339–347 peptide-loaded MHC class II and MHC class I tetramers. (a) Representative FACS plots of manually gated CD4 T cells (upper panels) or CD8 T cells (lower panels) show percentages of M37–47-tetramer+ CD4 T cells or N339–347-tetramer+ CD8 T cells (respectively marked orange or blue at 14 dpi). (b) Absolute numbers of M37–47-tetramer+ CD4 T cells (left panel) or N339–347-tetramer+ CD8 T cells (right panel). Results are shown as mean ± SEM, each data point represents one individual mouse (n = 4). (c) Histogram overlays show CD44 expression of total CD4 or CD8 T cells versus their respective tetramer+ populations at day 14 post-infection. M37–47-tetramer+ CD4 T cells and N339–347-tetramer+ CD8+ T cells, marked orange and blue, are gated as shown in (a). Data are normalized to and depicted as the percentage of the maximum count (% of max on the Y axis). Data are representative of three independent experiments. For statistics (Student’s t test with Welch correction), PVM-infected mice were compared to non-infected controls (day 0) as indicated.
