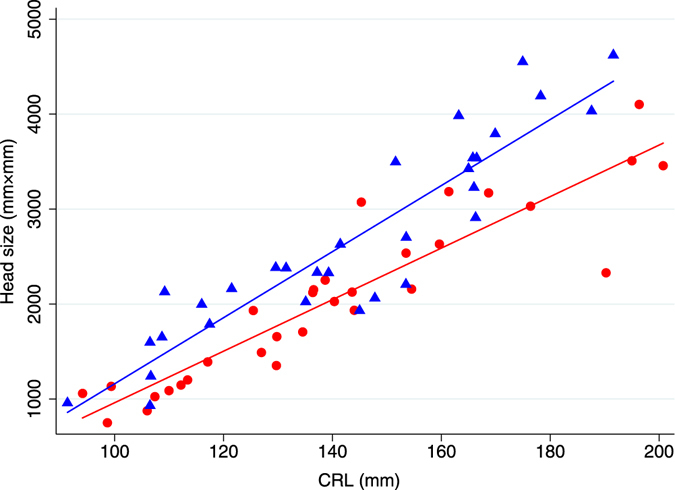
Figure 2.

Head size (mm2) as a function of CRL (mm) in Japanese monkey fetuses pre- and post-NNP disaster (n = 62). The figure shows regressions between head size and CRL in pre- and post-disaster groups. Blue triangles were pre-disaster monkey fetuses with the blue line representing the fitted values (n = 31); R2 = 0.85. Red circles were post-disaster monkey fetuses with the red line representing the fitted values (n = 31); R2 = 0.84.
