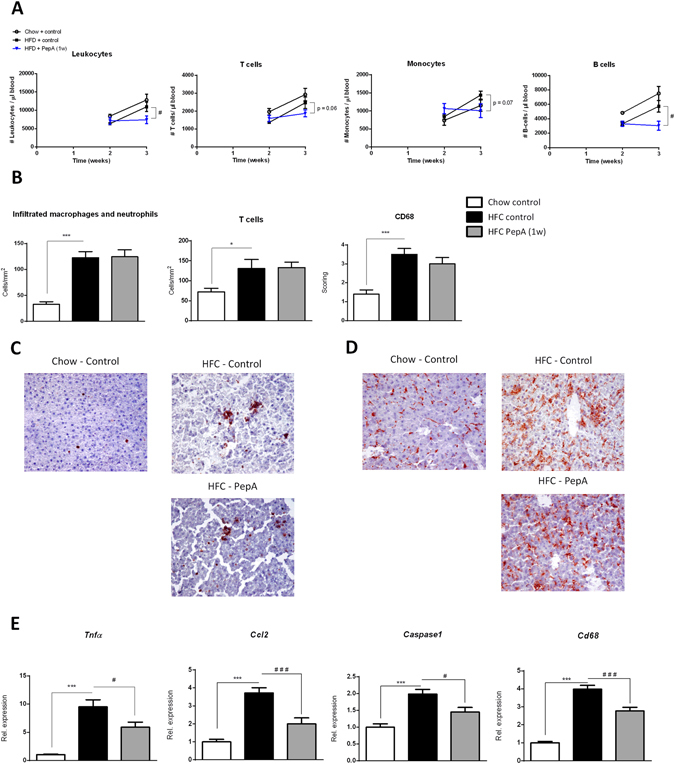
Figure 1.

Parameters of systemic and hepatic inflammation in control- and PepA-injected mice. (A) Absolute levels of leukocyte, T cell, monocyte and B cell populations at week 2 and 3 of the experiment. (B) Liver sections were stained for infiltrating macrophages and neutrophils (Mac-1), T cells (CD3) and resident monocytes/macrophages (CD68). Positive cells were counted (infiltrated macrophages/neutrophils and T cells) or scored (CD68). (C,D) Representative pictures of the Mac-1 (C) and CD68 staining (D) (original magnification, 200x). (E) Gene expression analysis of Tnfα, Ccl2, Caspase1 and Cd68. Data are shown relative to control mice on chow diet. Error bars represent ± SEM; *indicates p ≤ 0.05 and ***p < 0.001 compared to mice on chow diet; #indicates p ≤ 0.05 and ### p < 0.001 compared to control-injected mice on HFC diet by use of two-tailed unpaired t test; for FACS n = 4 animals per group and for immunohistochemistry and gene expression n = 8–11 animals per group.
