
Figure 2.
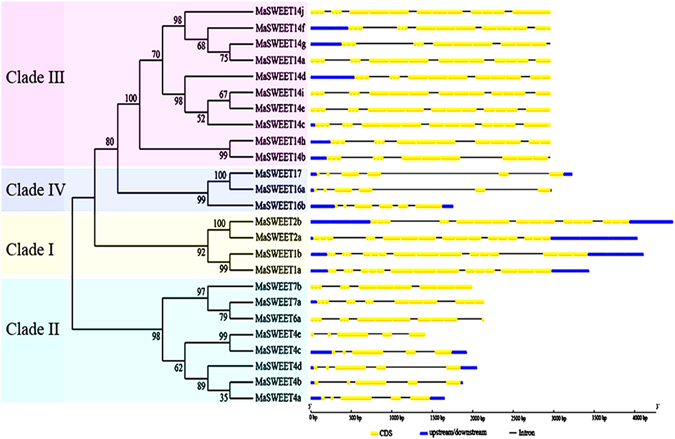
Gene structure analyses of MaSWEETs. Exon-intron structure analyses were performed using the Gene Structure Display Server database. Blue boxes indicate upstream/downstream; yellow boxes indicate exons; black lines indicate introns.
Official websites use .gov
A
.gov website belongs to an official
government organization in the United States.
Secure .gov websites use HTTPS
A lock (
) or https:// means you've safely
connected to the .gov website. Share sensitive
information only on official, secure websites.
Gene structure analyses of MaSWEETs. Exon-intron structure analyses were performed using the Gene Structure Display Server database. Blue boxes indicate upstream/downstream; yellow boxes indicate exons; black lines indicate introns.