Figure 2.

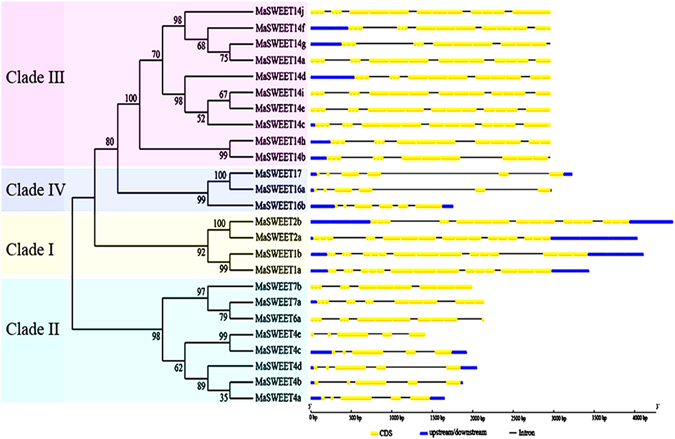
Gene structure analyses of MaSWEETs. Exon-intron structure analyses were performed using the Gene Structure Display Server database. Blue boxes indicate upstream/downstream; yellow boxes indicate exons; black lines indicate introns.

Gene structure analyses of MaSWEETs. Exon-intron structure analyses were performed using the Gene Structure Display Server database. Blue boxes indicate upstream/downstream; yellow boxes indicate exons; black lines indicate introns.