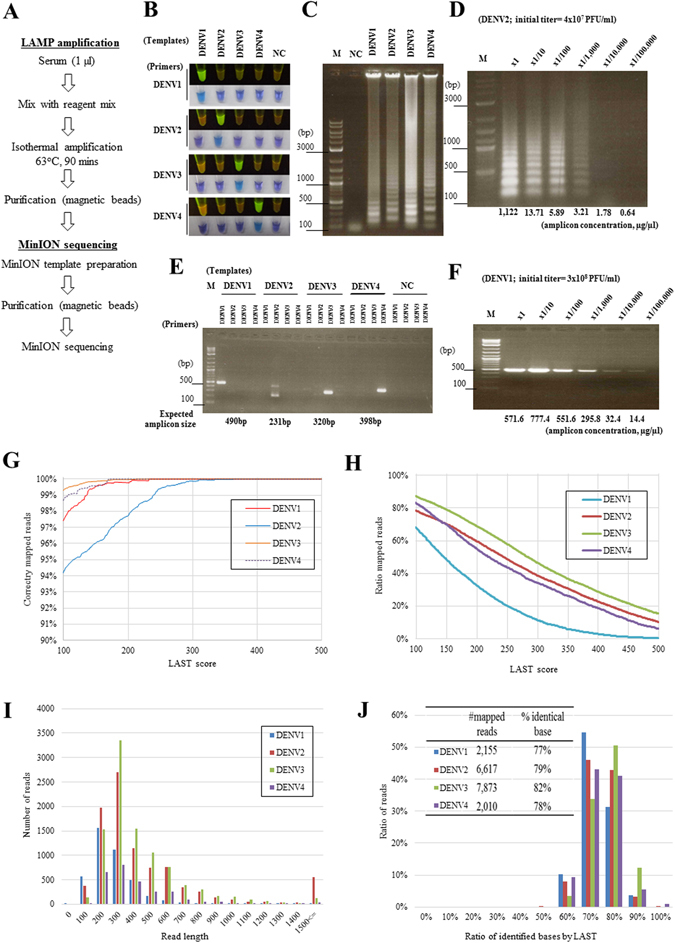
Figure 1.

Serotyping analysis of dengue virus using LAMP and MinION. (A) Schematic representation of the method using the LAMP amplification and MinION sequencing. (B) UV and visual light images and (C) agarose gel electrophoresis image of the LAMP amplicons obtained from the control templates. For (B) the top rows for each serotype are the UV images, and the bottom rows are under visual light. (D) Electrophoresis image of the LAMP products generated from a serially diluted control template of DENV2. The amplicon concentration was calculated using the Agilent Bioanalyzer. (E) RT-PCR amplification of the control viruses. (F) RT-PCR analysis of the DENV1 serially diluted control template. The amplicon concentration was calculated by the Agilent Bioanalyzer. (G) Precision and (H) recall rates of the sequence reads recovered at the cut-off score of LAST indicated on the x-axis. (I) Length distribution of the aligned reads. (J) The accuracy of the sequencing obtained by the flow cell version 7 was calculated by considering the matched bases between each sequence and the corresponding reference genome. The images from (B) to (F) are representative of three biological replicates.
