Figure 2.

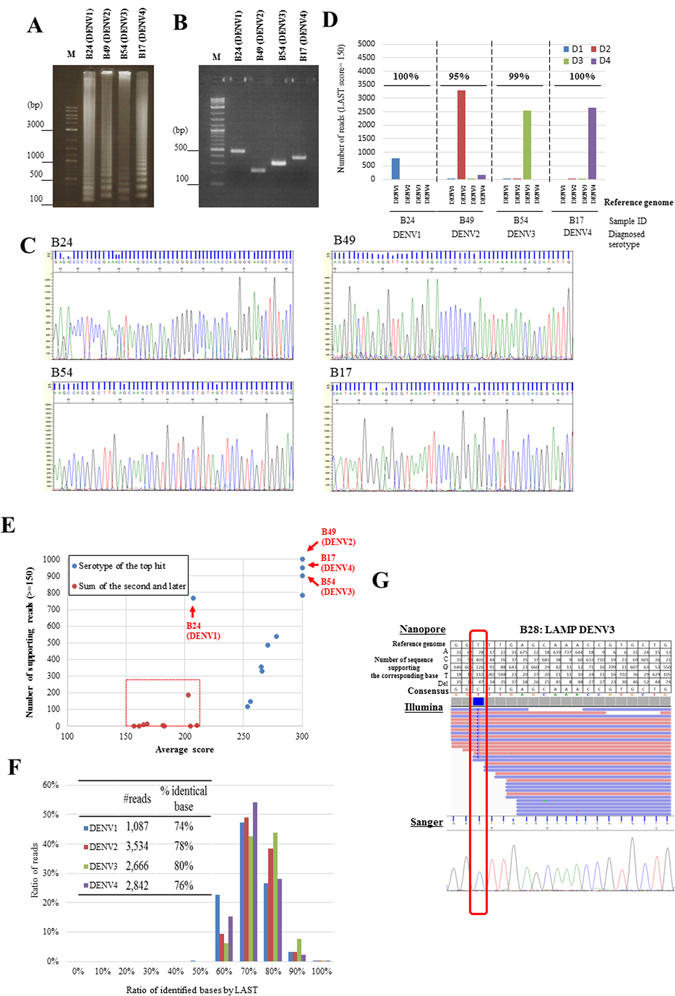
Serotype detection of clinical samples. (A–C) Results of the LAMP analysis (A), RT-PCR analysis (B) and Sanger sequencing (C) using clinical samples (n = 4). (D) Results of the MinION sequencing; the numbers of sequence reads corresponding to the indicated serotypes are shown. (E) Result of alignment for each sample, plotted according to the number (y-axis) and the average LAST scores of the reads that supported the serotypes of the top hits (blue dots) and the later hits (red dots) (n = 11). The range of negative signals (red dots) is indicated by the broken red box. Note that its range is clearly separate from the positive signals (blue dots). (F) The accuracy of the sequencing as calculated above. (G) Upper panel, MinION sequence alignment between the generated consensus sequence from a particular patient and the reference genome. Middle and lower panels, results from Illumina (middle panel) and Sanger sequencing (lower panel) using the same sample. The position of the identified SNV is highlighted by the red box. This image is a representation of one patient sample.
