Figure 3.

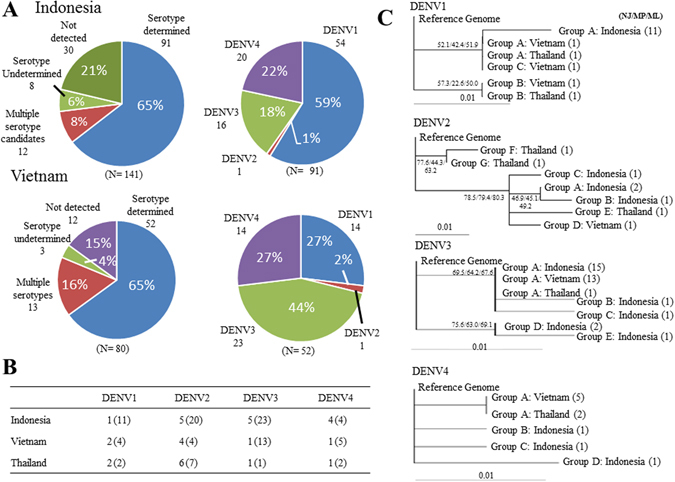
Serotyping of samples from Indonesia, Vietnam and Thailand. (A) Field application results from the serotyping analysis of 141 and 80 dengue patients from Indonesia and Vietnam, respectively. The left panels show the results of the viral identifications and their serotyping, and the right panels show the composition of the serotypes in this population. (B) SNVs found in each country for each serotype. The numbers in parentheses show the numbers of all samples that have SNVs, while the numbers outside the parentheses show the unique SNVs among those samples. (C) Phylogenetic tree showing the relationship of the DENVs from Indonesia, Vietnam and Thailand to the reference DENV for each serotype. A genetic distance of 0.01 is represented by the horizontal bar. Cross-validations by NJ (neighbor-joining)/MP (maximum parsimony)/ML (maximum likelihood) methods are shown in the margin. See the Materials and Methods section for further details. Note that for (B and C), the SNVs detected from the “serotype determined” and “multiple serotype candidates” groups were used.
