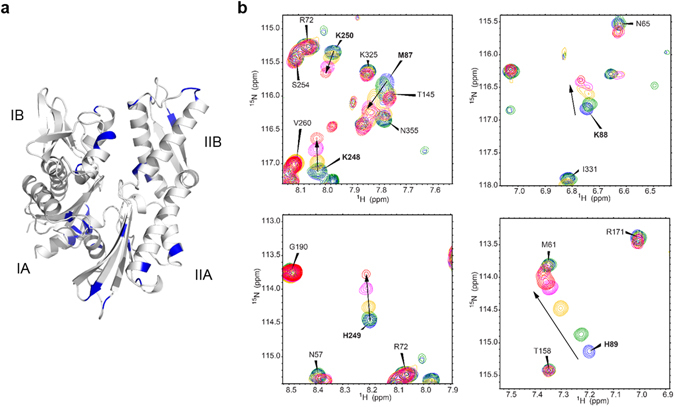
Figure 3.

Chemical shift perturbation. (a) Residues with large chemical shift changes (ΔδNH > 0.04 ppm) upon Az binding to an ATPase domain of Hsc70 were mapped in blue on the structure (PDB entry 2E8A). Subdomains IA, IIA, IB and IIB are shown in the structure (b) Chemical shift changes of M87-H89 and K248-K250 after addition of Az to an ATPase domain of Hsc70 are shown in 2D 15N-1H TROSY HSQC spectra. The ratios of protein to Az are 1:0 (blue), 1:0.5 (green), 1:1 (yellow), 1:1.25 (magenta) and 1:1.5 (red).
