
Figure 2.
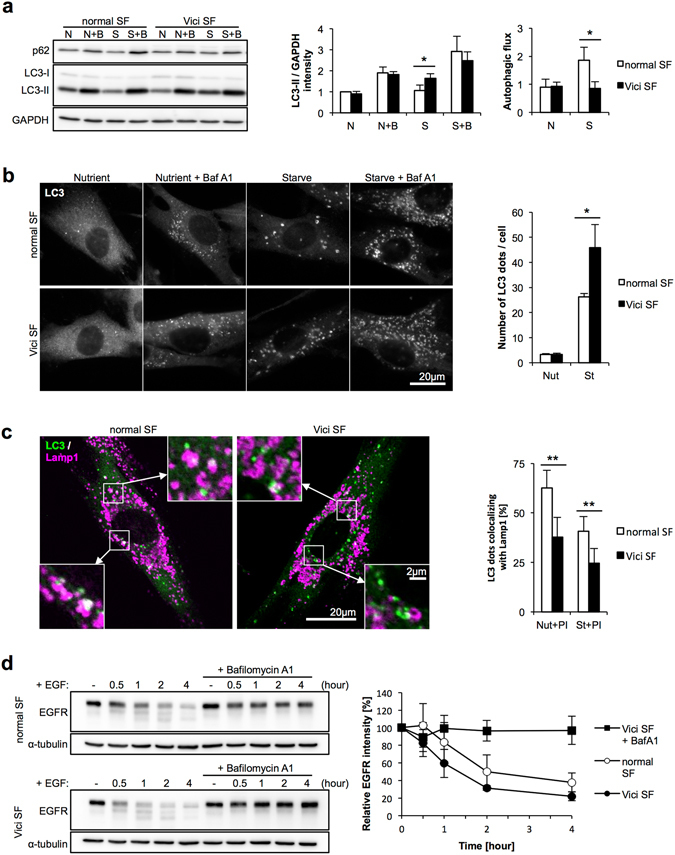
Mild autophagic impairment in VICIS SFs. (a) Normal and VICIS SFs were incubated in nutrient-rich or starved conditions with/without BafA1 for 6 hours. A representative western blot of LC3 and p62, and quantitative analysis of band intensities are shown. LC3 intensities were standardized by GAPDH intensities, and values relative to that of normal cells in nutrient-rich conditions without BafA1 are shown. Autophagic flux was calculated by subtracting values for BafA1 untreated samples from treated samples in each condition. Upon starvation, VICIS SFs exhibited mild accumulation of LC3-II and reduced autophagic flux. p62 is another substrate which is degraded by autophagy, but it showed little variation in expression. (b) SFs were incubated in nutrient-rich or starved conditions with/without BafA1 for 2 hours, followed by LC3 immunostaining. Representative images and quantified numbers of punctate LC3 staining per cell are shown. Under starved conditions, LC3 punctate staining was higher in VICIS SFs compared with normal SFs, which is consistent with the increased intensity of the LC3-II band in VICIS SFs under the starved conditions shown in (a). (c) SFs were incubated in nutrient-rich or starved conditions with/without protease inhibitors for 2 hours, followed by LC3 and Lamp1 immunostaining. Representative images and calculated percentages of punctate LC3 staining colocalized with Lamp1 are shown. Decreased colocalization between LC3 and Lamp1 staining in VICIS SFs indicates reduced autophagosome-lysosome fusion. (d) Conventional endocytic pathway activity assessed by EGFR degradation was normal in VICIS SFs. N or Nut, nutrient-rich conditions; S or St, starved conditions; B or BafA1, Bafilomycin A1; PI, protease inhibitors (E64d+ pepstatin A). Mean and SD from at least three independent experiments with 10 images assessed per treatment condition. Statistics by two-tailed Student’s t-test; *p < 0.05, **p < 0.01.