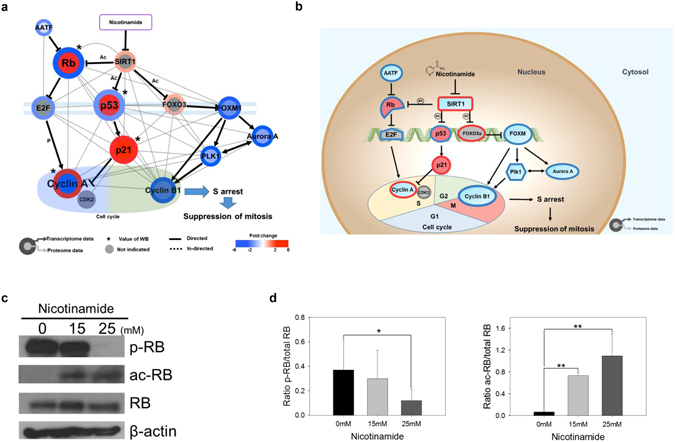
Figure 4.

Nicotinamide induces cell cycle arrest. (a) Cytoscape visualization of cell cycle regulatory network. The colors of the border and inside circle indicate the expression levels of transcriptome and proteome data, respectively. Gray edge indicates the protein-protein interaction based on the STRING database, whereas the arrows and inhibition symbols represent the activation and repression information, respectively. Nodes with asterisks indicate that the protein expression was assessed by only western blotting without the use of proteome data. There is no significant difference regarding the expression level if the color of the node is gray. (b) Proposed model of nicotinamide-induced cell cycle interaction network. Networks are represented by proteome, transcriptome and western blotting data. Red indicates increased expression, blue indicates decreased expression and gray indicates no significant difference. (c) Expression of RB and the phosphorylation and acetylation of RB in nicotinamide-treated cells were examined via western blotting. (d) Densitometry analysis of p-RB and ac-RB was quantitated using ImageJ. Values were normalized to the levels of RB. The data represent the mean ± SD (*P < 0.05, **P < 0.01). Abbreviations: ac - acetylation, p - phosphorylation, WB - western blot.
