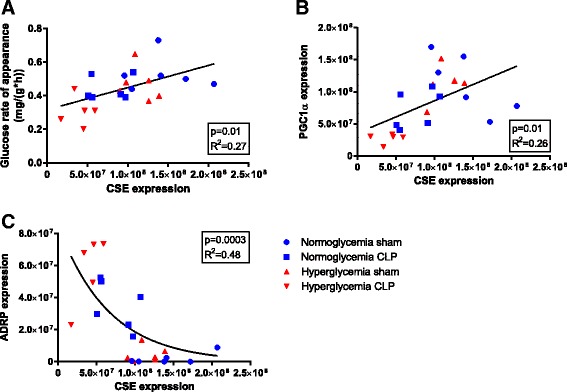
Fig. 5.

Glucose rate of appearance (a), peroxisome proliferator-activated receptor gamma coactivator 1-alpha (PGC1α) (b) and adipocyte differentiation-related protein (ADRP) (c) plotted as a function of cystathionine-γ-lyase (CSE) expression, pooled data from all experimental groups. R 2 is the Pearson’s coefficient for linear, and Spearman’s coefficient for non-linear relationships
