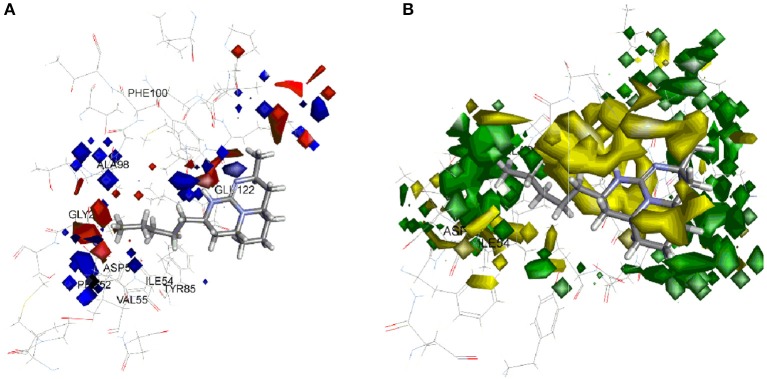
Figure 6.
Molecular field analysis contour map displayed with compound 37 and superimposition on active site of PfLDH (A) electrostatic interaction contour map; blue color represents positive coefficients while red color represents negative coefficients (B) steric interaction contour map; green color indicates positive coefficients and yellow color indicates negative coefficients.

