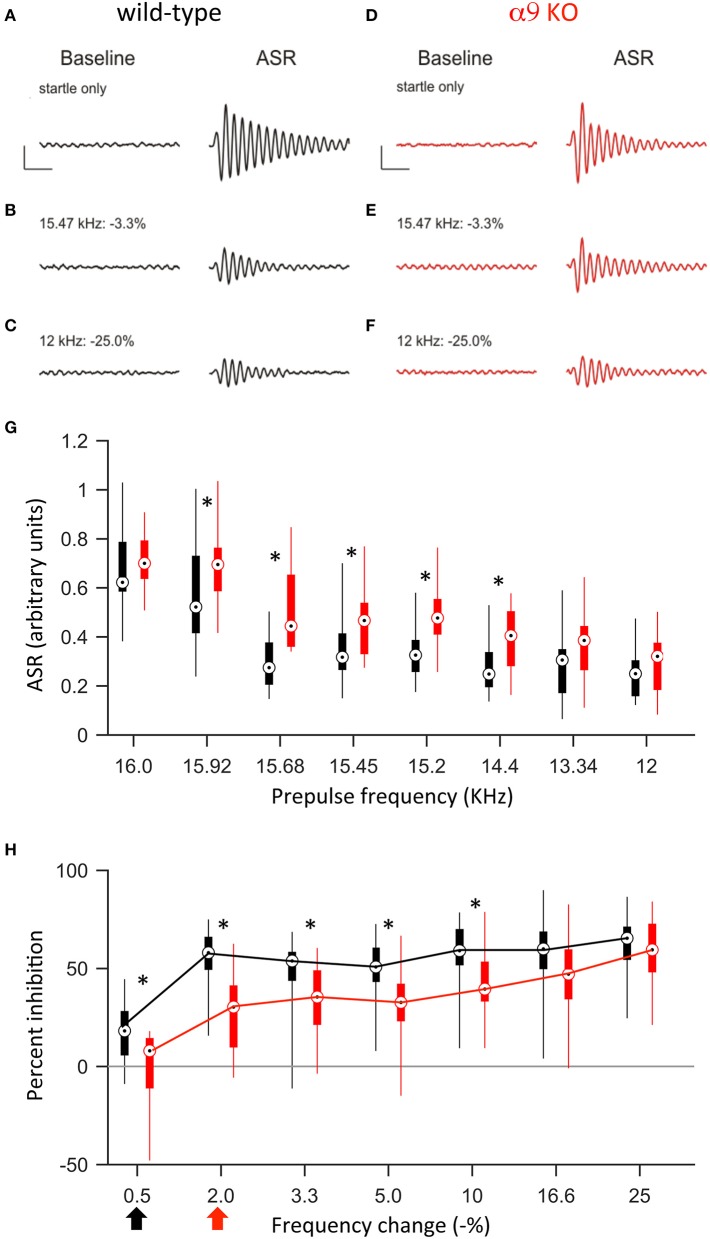
Figure 4.
At P14, α9KO mice show impaired PPI for small, but not large, changes in frequency. (A–F) Examples of baseline activity and acoustic startle response for control (black; A–C) and α9 KO (red; D–F) mice. Traces represent the force measured on the platform during the first 500 ms recording period, “baseline,” and force measured during the second 500 ms recording period, “ASR” for (A,B) startle only trials and (C–F) prepulse trials with frequency steps of increasing size. Prepulse trials are labeled with the frequency of the prepulse and magnitude of the resulting frequency change. For each trial, the maximum force recorded during the second recording period, in either the positive or negative direction, was reported as the ASR. Scale bars, 0.4 arbitrary units of force, 100 ms. (G) ASR amplitudes for control (black) and α9 KO (red) mice for each trial type. Data are presented as boxplots with boxes representing the 25th and 75th percentiles and vertical lines indicating full data range. Asterisks indicate that ASR magnitude for α9 KO mice is significantly different than ASR magnitude for control mice for that class of trials [Two way ANOVA, F(1, 248) = 36.5, p < 0.001, main effect of genotype, Holm–Sidak post-hoc pairwise comparison, t = 6.043, p < 0.001]. n = 20 control and 13 α9 KO animals. (H) Percent inhibition of the ASR caused by a prepulse frequency change of various magnitudes. Arrows indicate discrimination threshold, the smallest frequency change that caused significant inhibition of the ASR (p < 0.05, one-way t-test against zero) for control (black) and α9 KO (red) animals. Data represented as boxplots as in (G). Asterisks indicate significant differences [two-way Anova, F(1, 217) = 40.9, p < 0.001; Holm–Sidak post-hoc pairwise comparison, t = 6.395, p < 0.001]. n = 20 control and 13 α9 KO animals.

