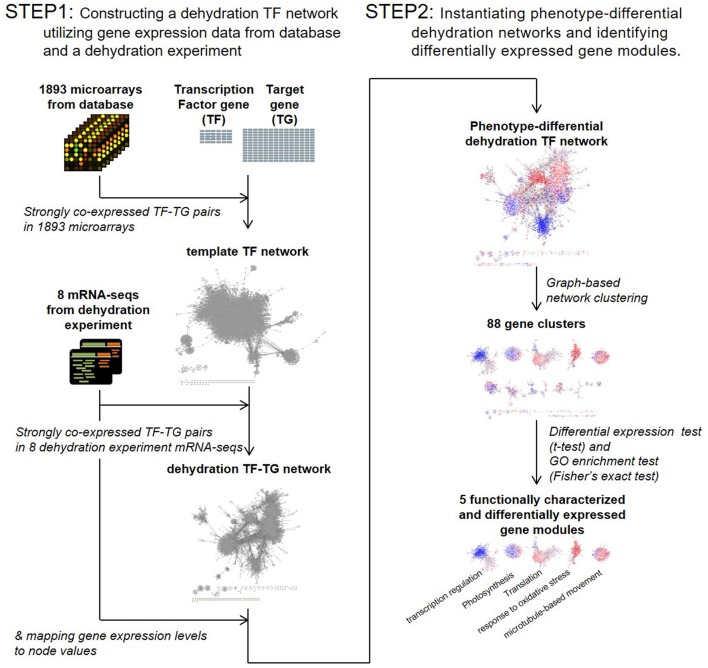
Figure 1.
Transcription factor (TF) network analysis workflow. A template TF network was constructed by selecting strongly co-expressed TF-target gene pairs in 1,893 public domain microarrays. A dehydration TF network was then constructed by selecting strongly co-expressed TF-target gene pairs in eight dehydration experiment mRNA sequencing data sets. Phenotype-differential dehydration networks were instantiated by mapping gene expression differences to node values. Clustering analysis was then performed. Differentially expressed gene modules were selected by t-test, and the biological function of gene modules was characterized by gene ontology (GO) analysis.

