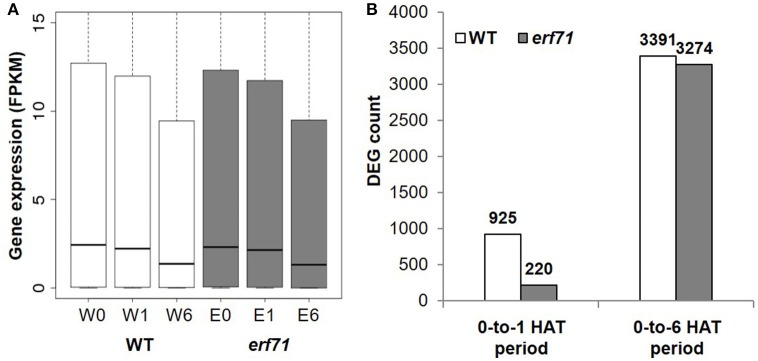
Figure 2.
Gene expression profiles under dehydration stress. (A) Gene expression levels in FPKM (Fragments Per Kilobase of exon per Million fragments mapped) for six samples (i.e., two plants for three time points): WT (white) and erf71 (gray) for 0, 1, and 6 h after treatment (HAT). Medians of gene expression (black lines in the center of the boxes) decrease as the dehydration stress continued. (B) The number of differentially expressed genes (DEGs) in WT (white) and erf71 (gray). In the 0-to-1 HAT period, the number of DEGs in the WT (925 genes) is much greater than that in erf71 (220 genes).

