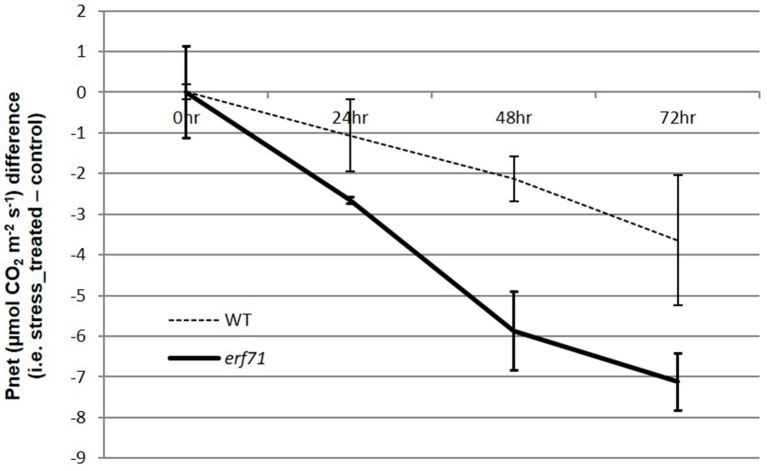
Figure 5.
Differences in net photosynthesis levels in WT and erf71 plants under drought stress treatment. The net photosynthesis levels were measured for WT and erf71 at four time points under drought stress and then normalized with respect to the control sample (i.e., stress treated sample–control sample). Error bars are pooled standard error of the means (pooled SEMs). The net photosynthesis level was down-regulated in both types of rice but more so in erf71.

