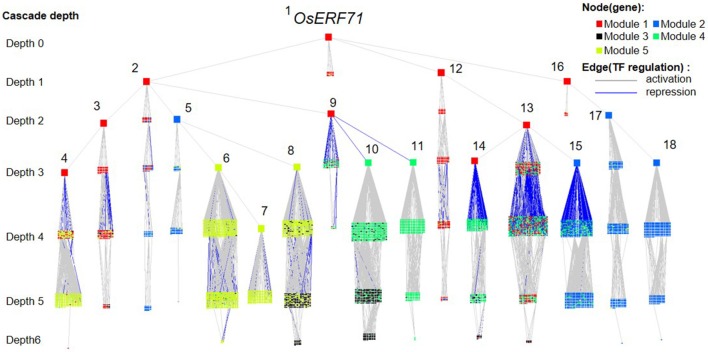
Figure 6.
OsERF71 cascade tree. This tree structure network was created by transforming the transcription factor (TF) regulatory network in Figure 3 into an OsERF71-rooted cascade tree. Nodes (n = 5,804) are TF or nonTF genes that are colored according to modules. Edges are TF regulatory relationships between pairs of genes that are colored according to positive/negative correlation. The cascade depth level on the left indicates the number of edges in the shortest path from OsERF71 to that point. Hub TFs that have more than 200 genes in their downstream are highlighted by using large node sizes with gene numbers from 1 to 18, whose corresponding gene IDs are Os06g0194000, Os07g0583700, Os08g0157900, Os04g0543500, Os03g0854500, Os06g0105800, Os03g0711100, Os03g0680800, Os03g0795900, Os06g0140400, Os01g0211800, Os12g0597700, Os03g0318600, Os04g0676700, Os10g0561400, Os06g0152200, Os11g0544700, and Os07g0496300, respectively. This network shows a holistic picture of potential regulatory paths to the five gene modules.

