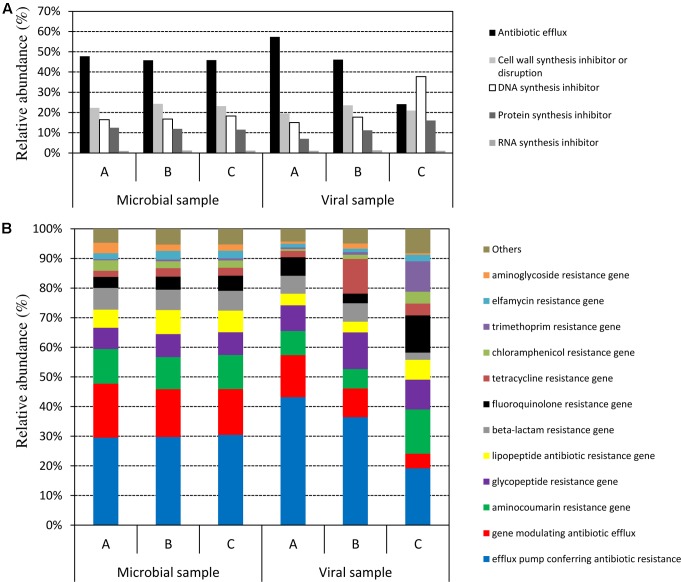
FIGURE 5.
Comparison of the distribution of antibiotic resistance-related reads among the microbial and the viral fraction of the three samples. (A) Distribution of the drug classes based on the inhibition target of the antibiotic. (B) Distribution of reads identified as antibiotic-resistance genes (ARGs) expressed as relative abundance with respect to the total ARGs-related reads identified.

