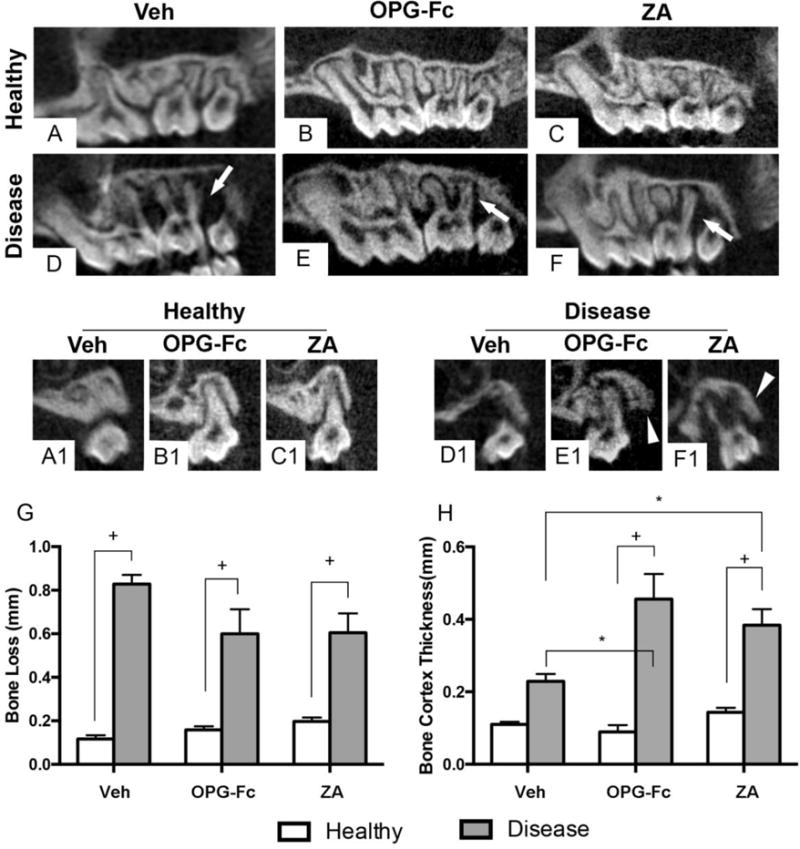
Figure 1. In-vivo μCT assessment of the maxillary molars prior to tooth extraction.

(A, B, C) Sagittal and (A1, B1, C1) coronal sections of sites with healthy molars in vehicle, OPG-Fc, and ZA groups, respectively. (D–F) Sagittal and (D1-F1) coronal sections of sites with diseased molars in vehicle, OPG-Fc, and ZA groups, respectively. Quantification of (G) interproximal bone loss and (H) buccal cortex thickness. + Statistically significantly different, p < 0.0001. *Statistically significant difference among compared groups, p < 0.05. Differences among groups were calculated by two-way ANOVA and post-hoc Tukey’s test for multiple comparisons. Data represent the mean ± SEM.
