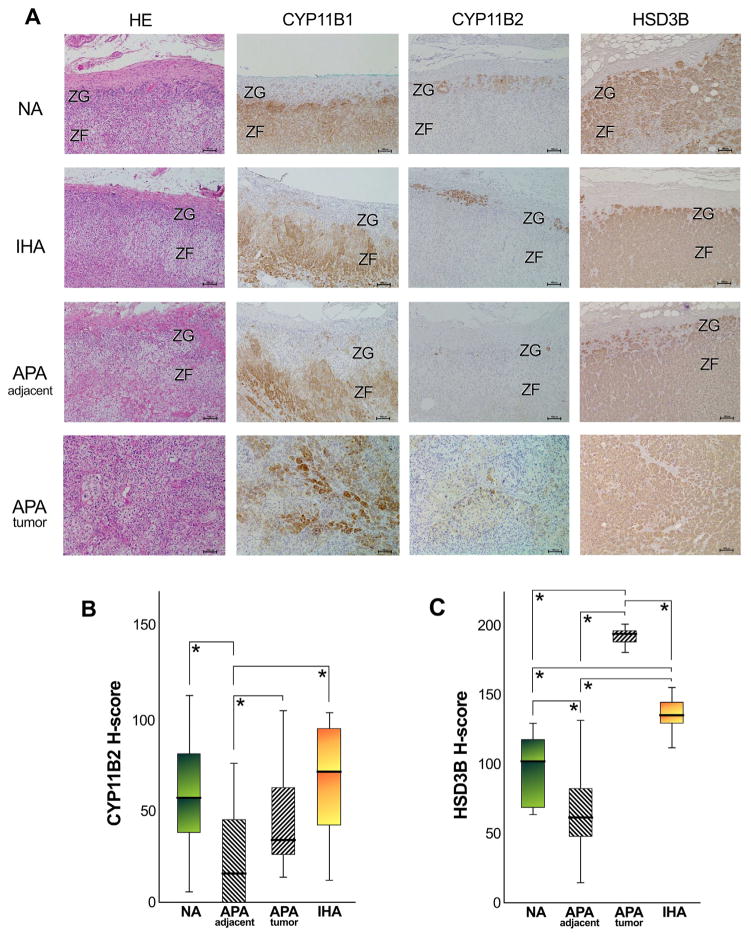
Fig. 4.
Immunohistochemistry of CYP11B1, CYP11B2 and HSD3B in non-pathological adrenals (NA), in idiopathic hyperaldosteronism (IHA), in the adrenal cortex adjacent to aldosterone-producing adrenocortical adenoma (APA-adjacent), and in the tumor lesion of APA (APA-tumor). [A] CYP11B1 was diffusely detected in the zona fasciculata (ZF) of NA, IHA, and APA-adjacent adrenal cortex, but was virtually absent in the zona glomerulosa (ZG); in addition, it was detected in patches of tumor cells of APA in a diffuse manner. CYP11B2 was detected in patches of ZG cells of NA and IHA, but was scantly detected or absent in the ZG of APA-adjacent adrenal cortex; the immunostaining of CYP11B2 was detected in islets or patches of cells surrounded by large areas of non-immunostained negative cells. Marked HSD3B immunoreactivity was detected in the ZG of NA and IHA, with a diffuse HSD3B immunostaining detected in the ZF of NA, IHA; however, its immunoreactivity was weaker in the APA-adjacent ZG. Marked HSD3B immunoreactivity was also detected in the APA-tumor cases. [B] The quantitative analysis of CYP11B2 immunoreactivity using H-score demonstrated that its levels were significantly lower in APA-adjacent adrenocortical samples, compared to NA (*P = 0.0020), to IHA (*P = 0.0008) and APA-tumor samples (*P = 0.0011). [C] The quantitative analysis of HSD3B immunoreactivity demonstrated that its levels were significantly lower in APA-adjacent adrenocortical samples, compared to NA (*P = 0.0034), to IHA (*P < 0.0001) and APA-tumor samples (*P < 0.0001); in addition, the HSD3B immunoreactivity was significant lower in NA compared to APA (*P < 0.0001) and IHA (*P = 0.0017), and significantly higher in APA compared to IHA (*P < 0.0001). The tissue samples illustrated in this figure are: NA 04, IHA 04, APA 16 (adjacent) and APA 07 (tumor) as listed in Table 1.

