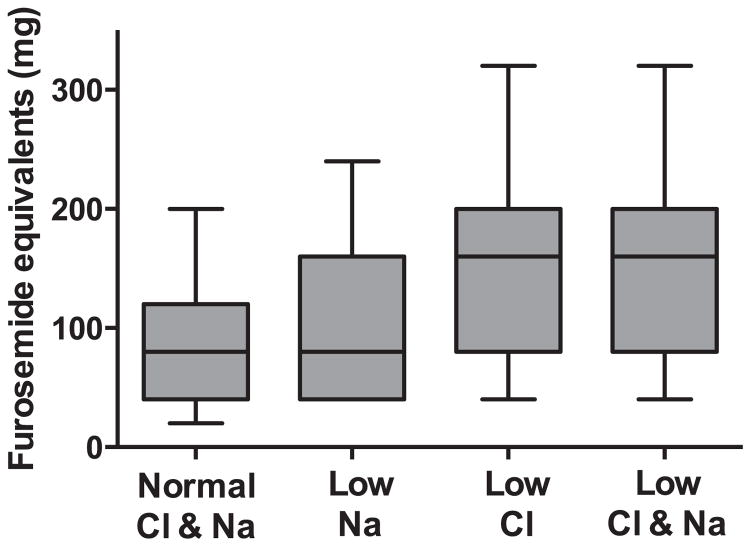
Figure 2.
Box plot of baseline loop diuretic dose based on groups defined by the presence or absence of hyponatraemia or hypochloraemia. Boxes represent the 25th to 75th percentile, the line represents the median, and whiskers the 10th and 90th percentile. P < 0.001 for all comparisons apart from the comparison between patients with isolated hypochloraemia and those with hypochloraemia and hyponatraemia (rightward two boxes) where P = 0.72.

