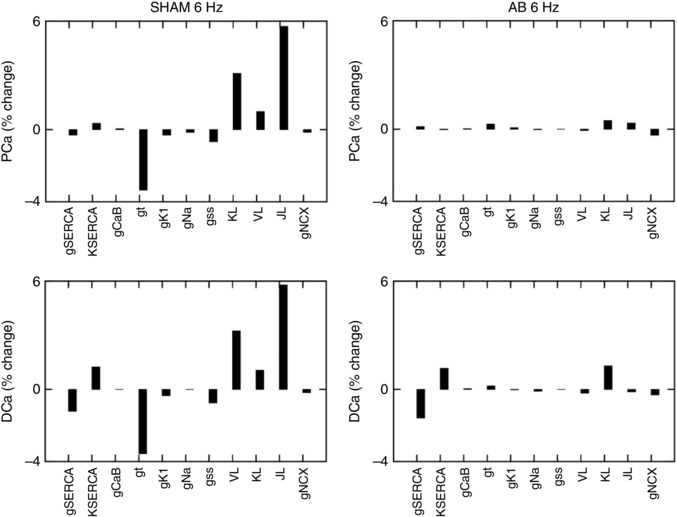
Figure 3. Sensitivity analysis on PCa and DCa at 1%.

Percentage changes in peak [Ca2+]i (PCa) and diastolic [Ca2+]i (DCa) in the SHAM case (left panels) and AB case (right panels). Sensitivity was studied by performing a 1% increase of the most important protein parameters changing from SHAM to AB: g SERCA, K SERCA, g CaB, g t, g K1, g Na, g ss, J L and g NCX. In the case of the sensitivity value being positive, an increase in the parameter will lead to an increase in the output. In the case of the sensitivity value being negative, an increase in the parameter will lead to a decrease in the output.
