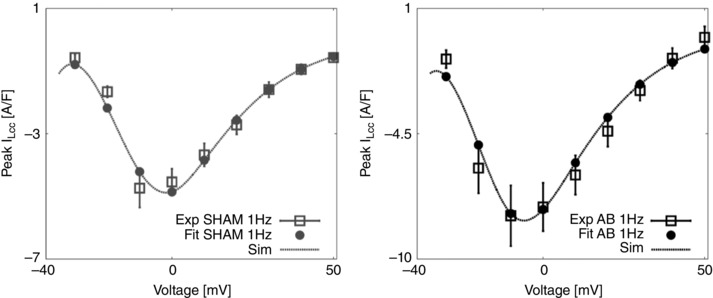
Figure 8. LCC fitting procedure and results.

Left, bell shaped peak I LCC–V relationship, experiments for the SHAM case at 1 Hz are represented as mean ± standard deviation (grey boxes) and fit (grey circles and dashed grey line). Right, bell shaped peak I LCC–V relationship, experiments for the AB case at 1 Hz are represented as mean ± standard deviation (black boxes) and fit (black circles and dashed black line).
