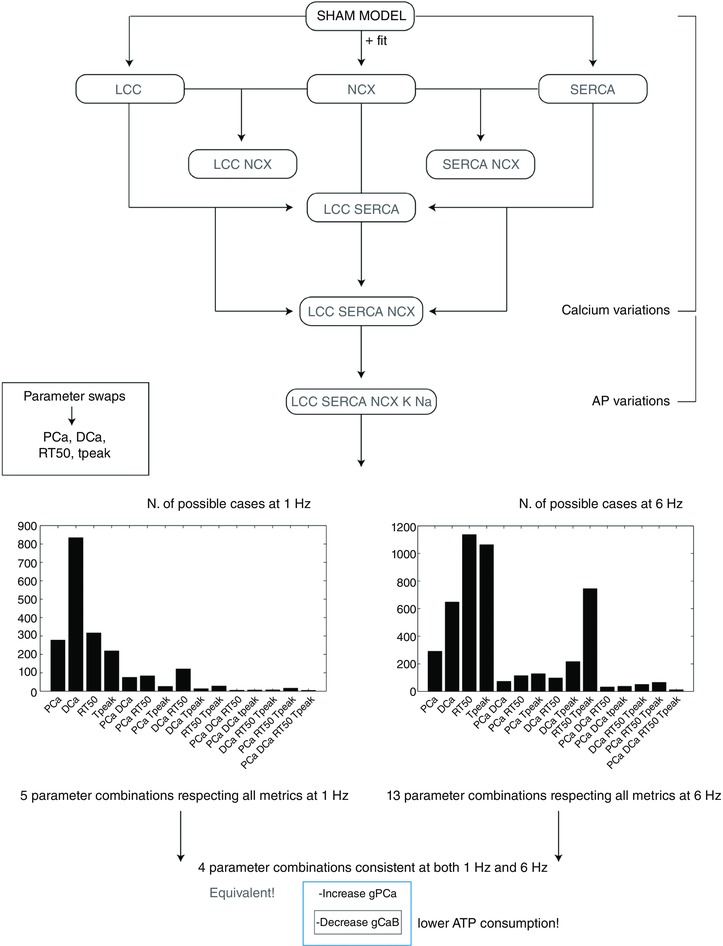
Figure 9. Schematic representation of the validation method.

Starting from the SHAM model at 1 Hz we have developed nine models by introducing single fittings for LCC, SERCA and NCX (3 models), combination of those (4 models) and all the fittings plus changes in K+ and Na+ channels (1 model) and K+, Na+ and CaB channels (1 model). For each of the nine models we have then performed parameter swaps of the most important protein parameters: g SERCA, K SERCA, J L, J R, g CaB, g SRl, g t, g NCX, g pCa, g BK, g BNa, g K1, g Na, g ss, NaKmax, B CMDN and B TRPN. The same process was repeated at 6 Hz. All developed models, representing 5814 parameter combinations (18 models × 17 parameters × 19 values) were run to steady state. For each model we have recorded PCa, DCa, RT50 and T peak. Ultimately, we have observed the number of combinations for which simulated PCa, DCa, RT50 and DCa fall within 20% variability of those four experimentally measured metrics. [Color figure can be viewed at wileyonlinelibrary.com]
