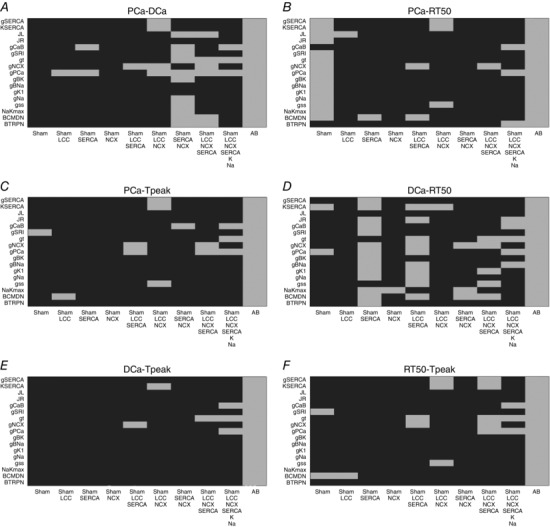
Figure 11. Metric couples at 1 Hz.

Parameters combinations falling inside (grey) and outside (black) experimental ranges for two metrics. A, possible combinations of parameters falling inside a 20% variability range from PCa and DCa experimental measurements (grey). B, possible combinations of parameters falling inside a 20% variability range from PCa and RT50 experimental measurements (grey). C, possible combinations of parameters falling inside a 20% variability range from PCa and T peak experimental measurements (grey). D, possible combinations of parameters falling inside a 20% variability range from DCa and RT50 experimental measurements (grey). E, possible combinations of parameters falling inside a 20% variability range from DCa and T peak experimental measurements (grey). F, possible combinations of parameters falling inside a 20% variability range from RT50 and T experimental measurements (grey).
