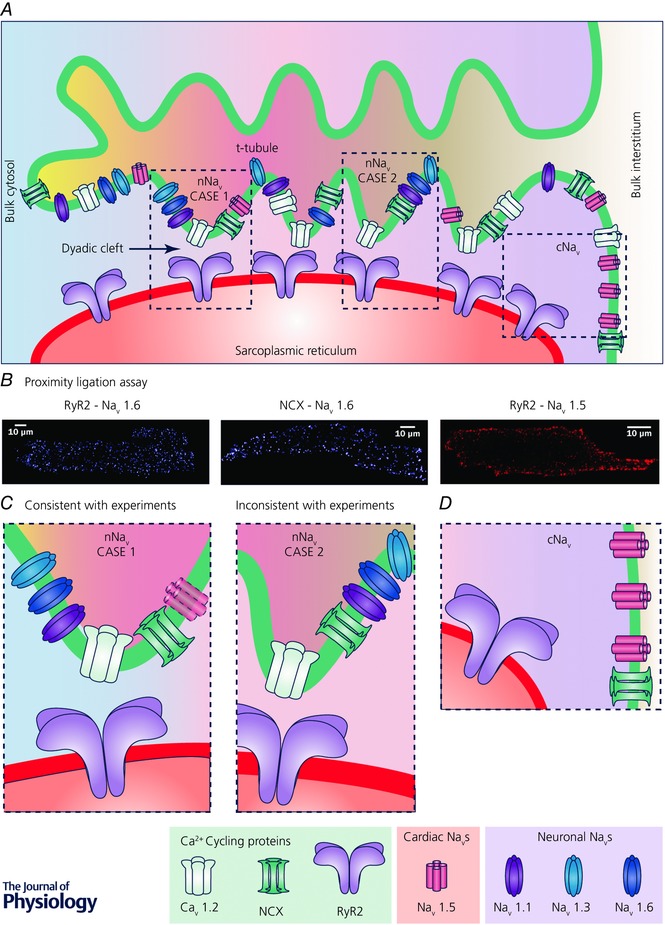
Figure 1. Schematic diagram showing the protein machinery of cardiac Na+–Ca2+ cycling.

A, schematic diagram of a t‐tubule and associated junctional SR. Microfolds in t‐tubule are depicted based on recent findings (Hong et al. 2014; Lavorato et al. 2015). Different arrangements of Ca2+ cycling proteins and sodium channels are depicted along the t‐tubule. Regions highlighted by the dashed boxes are presented at higher magnification in C and D. Note that differential shading of the interstitial space within the t‐tubule and the cytoplasm within the dyadic cleft indicates local differences in ionic concentrations within these spaces due to their diffusional isolation from the bulk interstitial space and cytoplasm, respectively. B, results from Duolink proximity ligation assays (PLAs) show close association of nNaV isoform NaV1.6 with both RyR2 and NCX throughout murine myocytes, consistent with enrichment of nNaVs in t‐tubules. In contrast, PLA signal corresponding to association between cNaV (NaV1.5) and RyR2 is only observed at the periphery of the cell, consistent with cNaV localization at the lateral membrane. Adapted from Radwański et al. (2016). C, higher magnification views of regions from A showing two possible scenarios of nNaV localization within t‐tubules. Left, case 1, very close association between nNaVs and RyRs, which is consistent with PLA results. A cNaV is depicted faded since experimental results including PLA results argue against cNaV enrichment in t‐tubules. Right, case 2, nNaVs localized to t‐tubules but not very closely associated with RyRs, which is not consistent with PLA results. D, higher magnification view of region from A showing cNaV (NaV1.5) localization at the lateral membrane.
