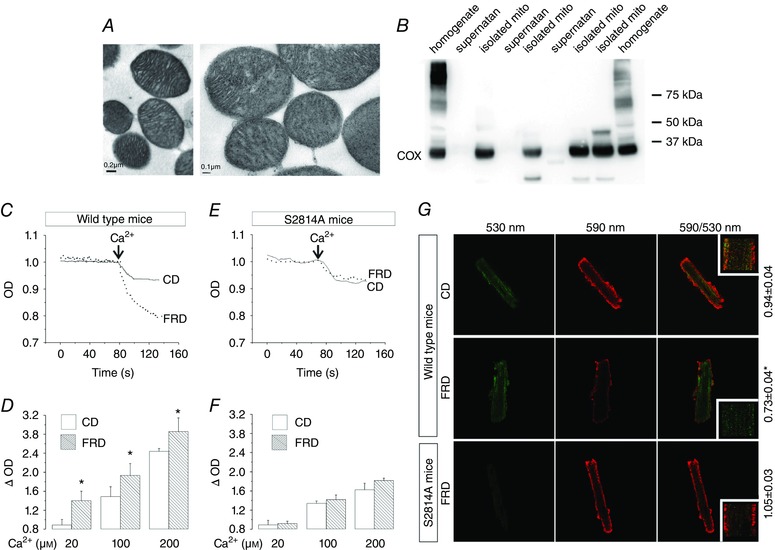
Figure 5. Phosphorylation of Ser2418 of RyR2 is related with mitochondria damage.

A, transmission electron micrographs of isolated mitochondria at two different magnifications. B, representative immunoblots of different fractions of the mitochondria isolation procedure; expression of the cyclooxygenase enzyme (COX, present only in mitochondria), in the final fraction (isolated mito), shows the preservation of the organelle during the protocol. A and B denote the purity of the isolated mitochondria preparations. C, representative trace of the optical density (OD) of isolated mitochondria from WT mice, showing a more pronounced light scattering in FRD than in CD mouse mitochondria after a Ca2+pulse. D, average data of the experiments from C, showing that ΔOD increases significantly in FRD with respect to CD mouse mitochondria, at the different concentrations of Ca2+ used. E, representative traces of OD in isolated mitochondria from S2814A mice, showing no significant difference in light scattering between CD and FRD mitochondria after a Ca2+ pulse. F, average data of the experiments from E, showing no difference in the ΔOD between CD and FRD in S2814A mice at the different concentrations of Ca2+ used. * P < 0.05 vs CD, n = 4–8 mice per group. G, representative photographs of isolated myocytes from CD and FRD WT and S2814A mice labelled with JC‐1. Green indicates mitochondria depolarization, and red mitochondria polarization at −180 mV. The decrease in the ratio 590/530 nm indicates mitochondria depolarization. The average data is shown at the right side of the photographs. * P < 0.05 vs CD, n = 6–12 cells from 3–5 mice per group.
