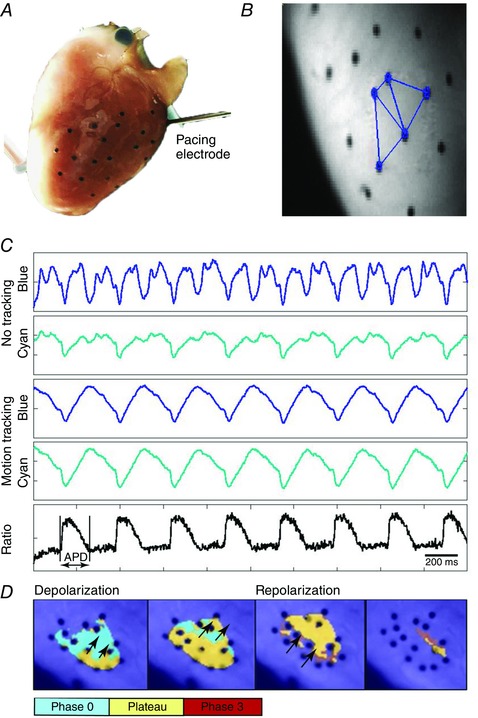
Figure 1. Optical mapping of transmembrane potential from the epicardial surface of unconstrained contracting rabbit hearts using motion tracking of fiducial markers and di‐4‐ANEPPS excitation ratiometry.

A, fiducial markers (black dots) were placed on the LV epicardium to enable tracking of local contractile motion. The LV pacing electrode is shown. B, markers were triangulated and local motion trajectories were computed for each triangle to remove motion artefact from fluorescence signals. Three such triangles are shown on a raw fluorescence image. C, di‐4‐ANNEPS fluorescence from one pixel is shown for blue and cyan excitation light before (first two signals) and after motion removal (signals three and four). The ratio of the motion corrected signals for blue and cyan excitation reveals the optical APs (last signal). D, pseudocoloured images of the upstroke (phase 0), plateau and repolarization (phase 3) of optical APs illustrate the propagation of paced waves across the epicardium on which markers were placed.
