
Figure 4.
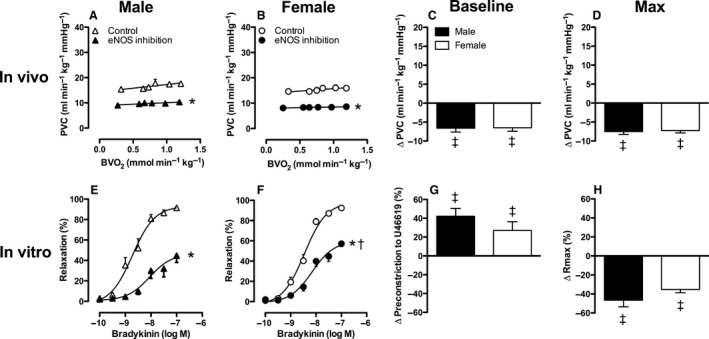
Effect of NO synthase on pulmonary vascular conductance in vivo at rest and during exercise (Panels A–D) and on bradykinin‐induced vasodilation in vitro (Panels E–H) in male and female swine. Panels C and G show the change at baseline and panels D and H show the change at maximum compared to control. Values are mean ± SEM. *P ≤ 0.05 versus corresponding control; † P ≤ 0.05 female versus male swine; ‡ P ≤ 0.05 versus no change in Pulmonary vascular conductance. (e.g., vs. zero). PVC, Pulmonary vascular conductance; Rmax, maximum relaxation.