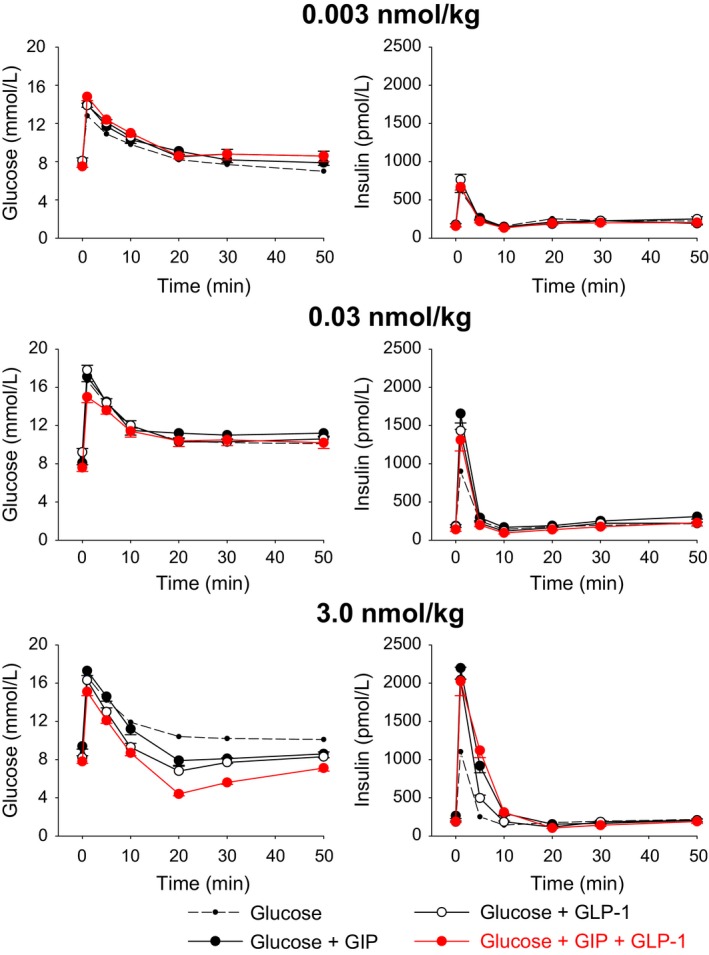
Figure 2.

Glucose and insulin concentration time courses (mean ± SE) after intravenous injection of glucose (0.35 g/kg) alone or with either GIP or GLP‐1 at 0.003 nmol/kg (subthreshold dose), 0.03 nmol/kg (submaximal dose), or 3.0 nmol/kg (maximal dose) or with the two incretin hormones in combination. Number of animals in each group is reported in Table 1.
