
Figure 3.
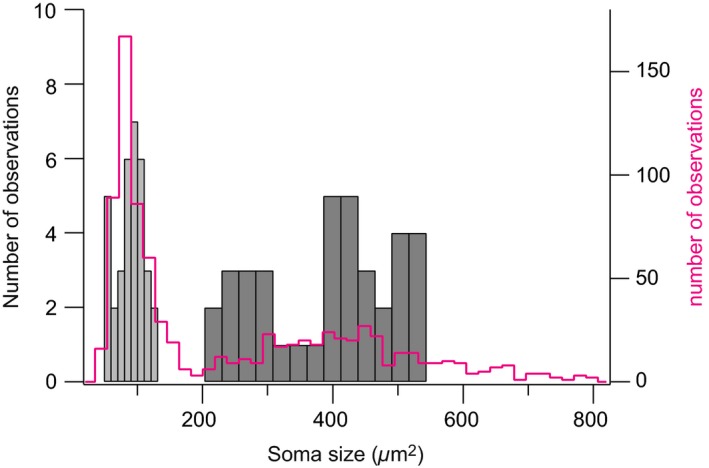
Distribution of soma size (area) of Dbx1‐derived preBötC neurons and glia. The histogram for neurons is plotted in dark gray bars (right, bin size 26 μm2). The histograms for glia are plotted in light gray bars (left, bin size 10 μm2). Statistics (mean ± SD) are given in the main text. The magenta line represents the soma size (area) distribution of all cells in the timed‐tamoxifen experiments (n = 1,049 cells counted in 18 different animals, bin size 18 μm2).