. 2017 Apr 19;8(6):4571–4578. doi: 10.1039/c7sc00402h

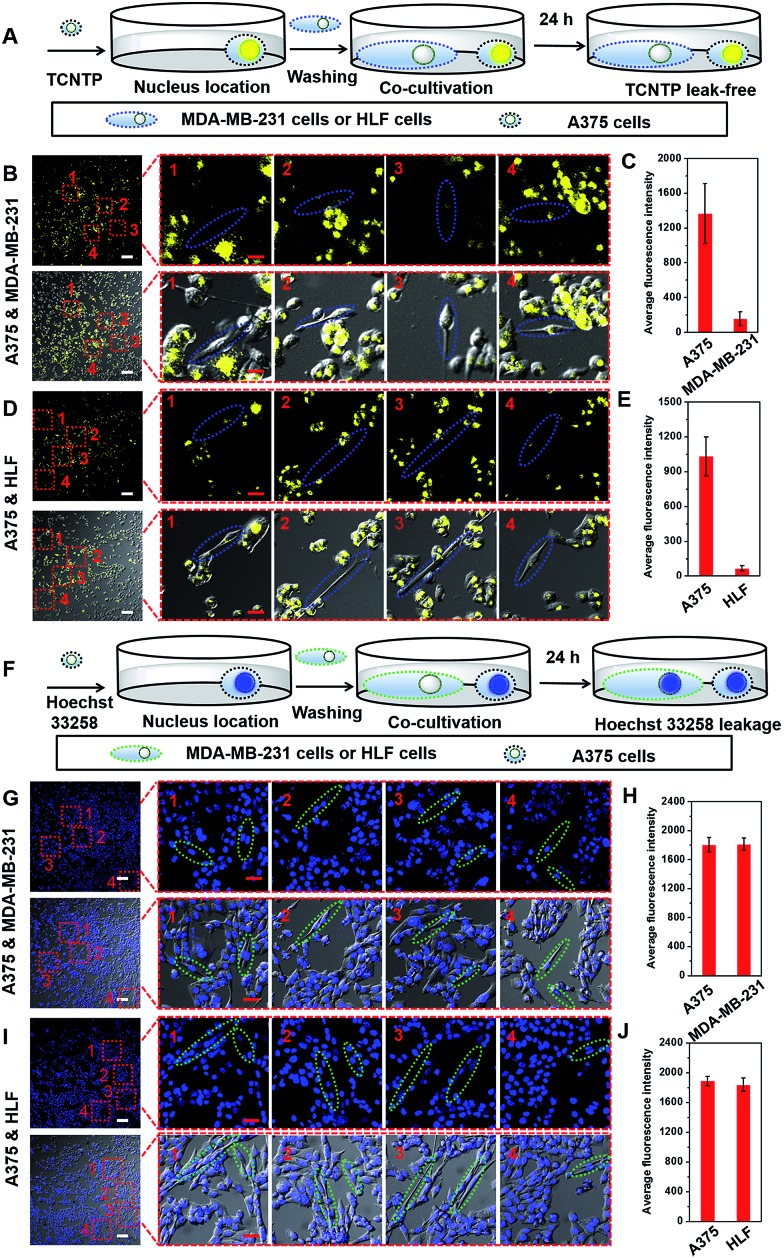
Fig. 6. The experimental scheme of TCNTP-stained (A) or Hoechst 33258-stained (F) A375 cells co-cultured with unstained cells. The CLSM imaging of co-cultivated TCNTP-stained (B) A375 cells and unstained MDA-MB-231 cells (the blue ellipses) or (D) TCNTP-stained A375 cells and unstained HLF cells (the blue ellipses). The average fluorescence intensity of TCNTP in four partial enlarged views (C and E). The CLSM imaging of co-cultivated Hoechst 33258-stained (G) A375 cells and unstained MDA-MB-231 cells (the green ellipses) or (I) Hoechst 33258-stained A375 cells and unstained HLF cells (the green ellipses). The average fluorescence intensity of Hoechst 33258 in four partial enlarged views (H and J). The blue fluorescence channel: excitation wavelength, 405 nm; emission collected, 425–485 nm. The yellow fluorescence channel: excitation wavelength, 405 nm; emission collected, 495–575 nm. The white scale bar is 100 μm. The red scale bar is 20 μm.

Fig. 6